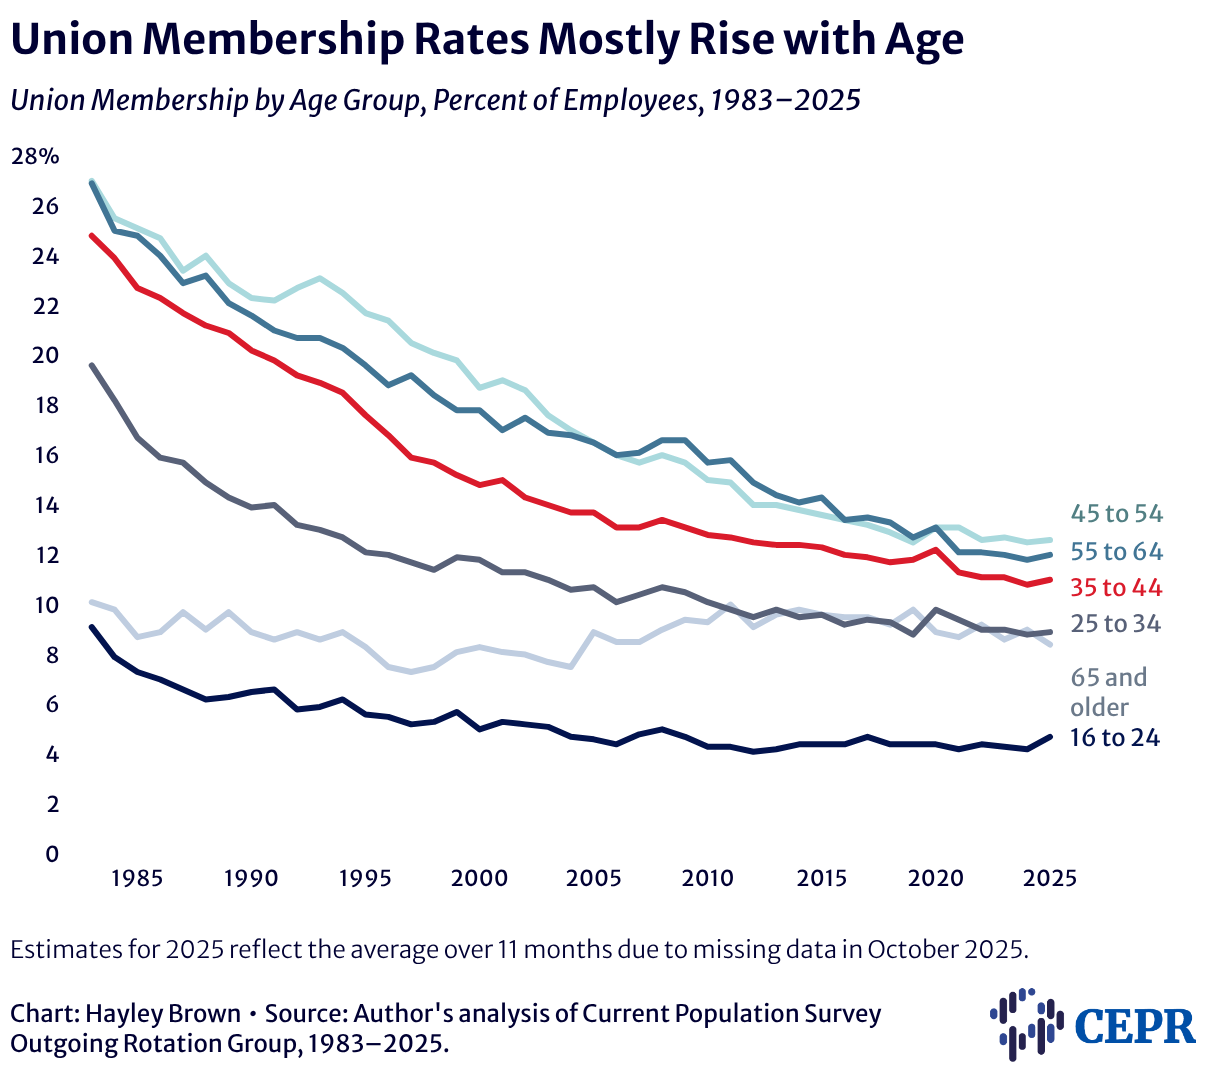
Union Membership Rates Mostly Rise with Age
Union Membership by Age Group, Percent of Employees, 1983–2025
Line chart showing union membership density by age group from 1983 through 2025. Union membership is lowest among those ages 16 to 24 (navy line) and highest among those ages 45 to 54 (light teal line), followed closely by those ages 55 to 64 (medium blue line). Union membership declined across all age groups, but the decline was least pronounced for those ages 65 and older (light gray line). Those ages 25 to 34 (medium gray line) and ages 35 to 44 (red line) saw especially sharp drops in union membership over this period.

Estimates for 2025 reflect the average over 11 months due to missing data in October 2025.