Opioid Overdose Mortality
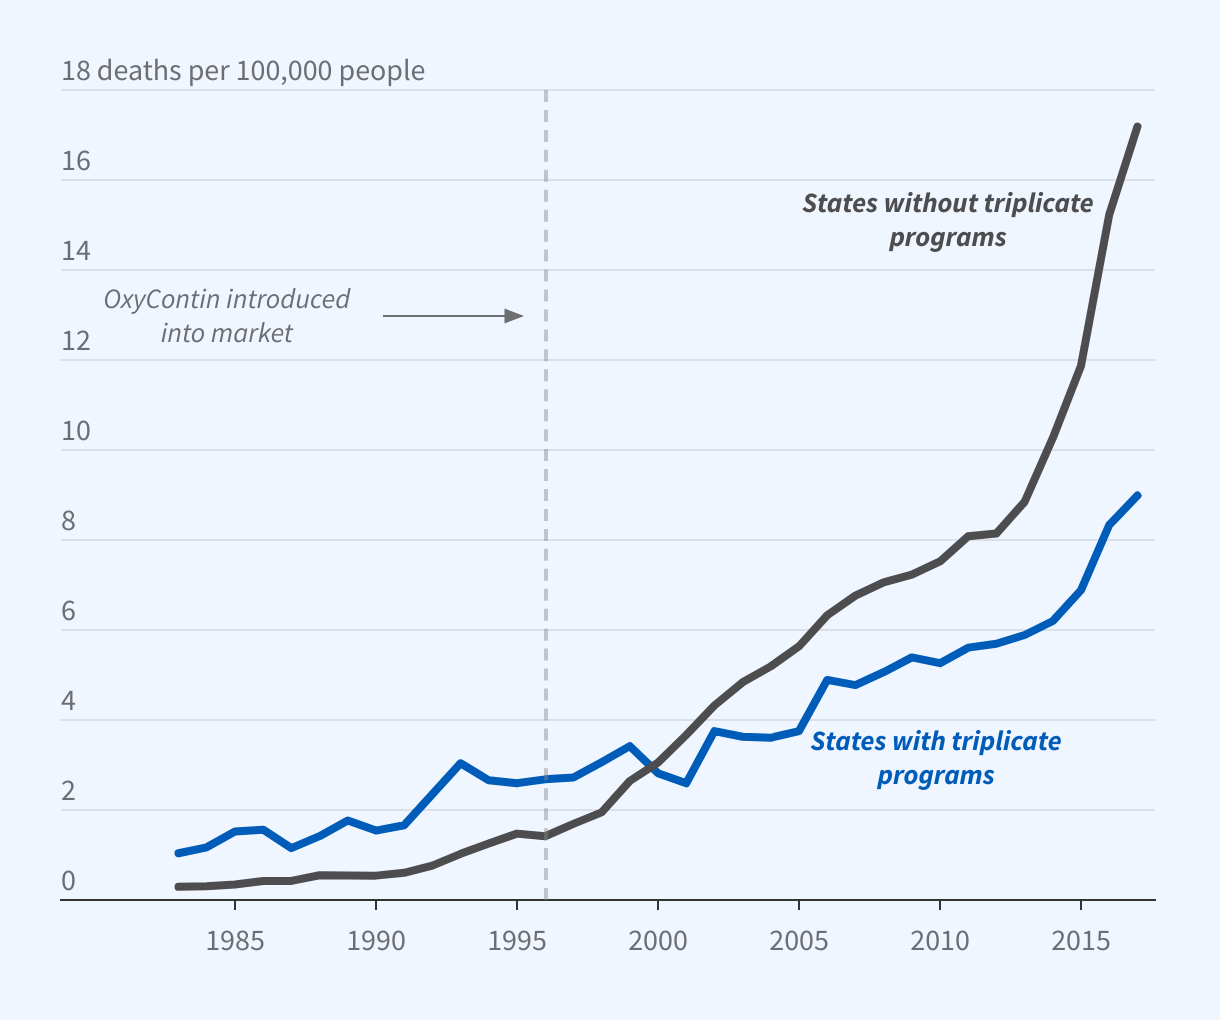
The graph is a line chart titled, “Opioid Overdose Mortality.”
The y-axis ranges from 0 to 18 deaths per 100,000 people, and the x-axis spans the years 1983 to 2017. OxyContin was introduced into the market in 1996.
Opioid overdose mortality in states without triplicate programs was about 0, but increased to about 17 deaths per 100,000 people in 2017. The mortality rates in states with triplicate programs were about 1 and 9 deaths per 100,000 people in 1983 and 2017, respectively.
Source: Alpert A, Evans W, Lieber E, Powell D. NBER Working Paper 26500, and published as "Origins of the Opioid Crisis and Its Enduring Impacts," Quarterly Journal of Economics, 137(2), 2022, pp 1139–79