California health care employment by U.S. congressional district, 2023
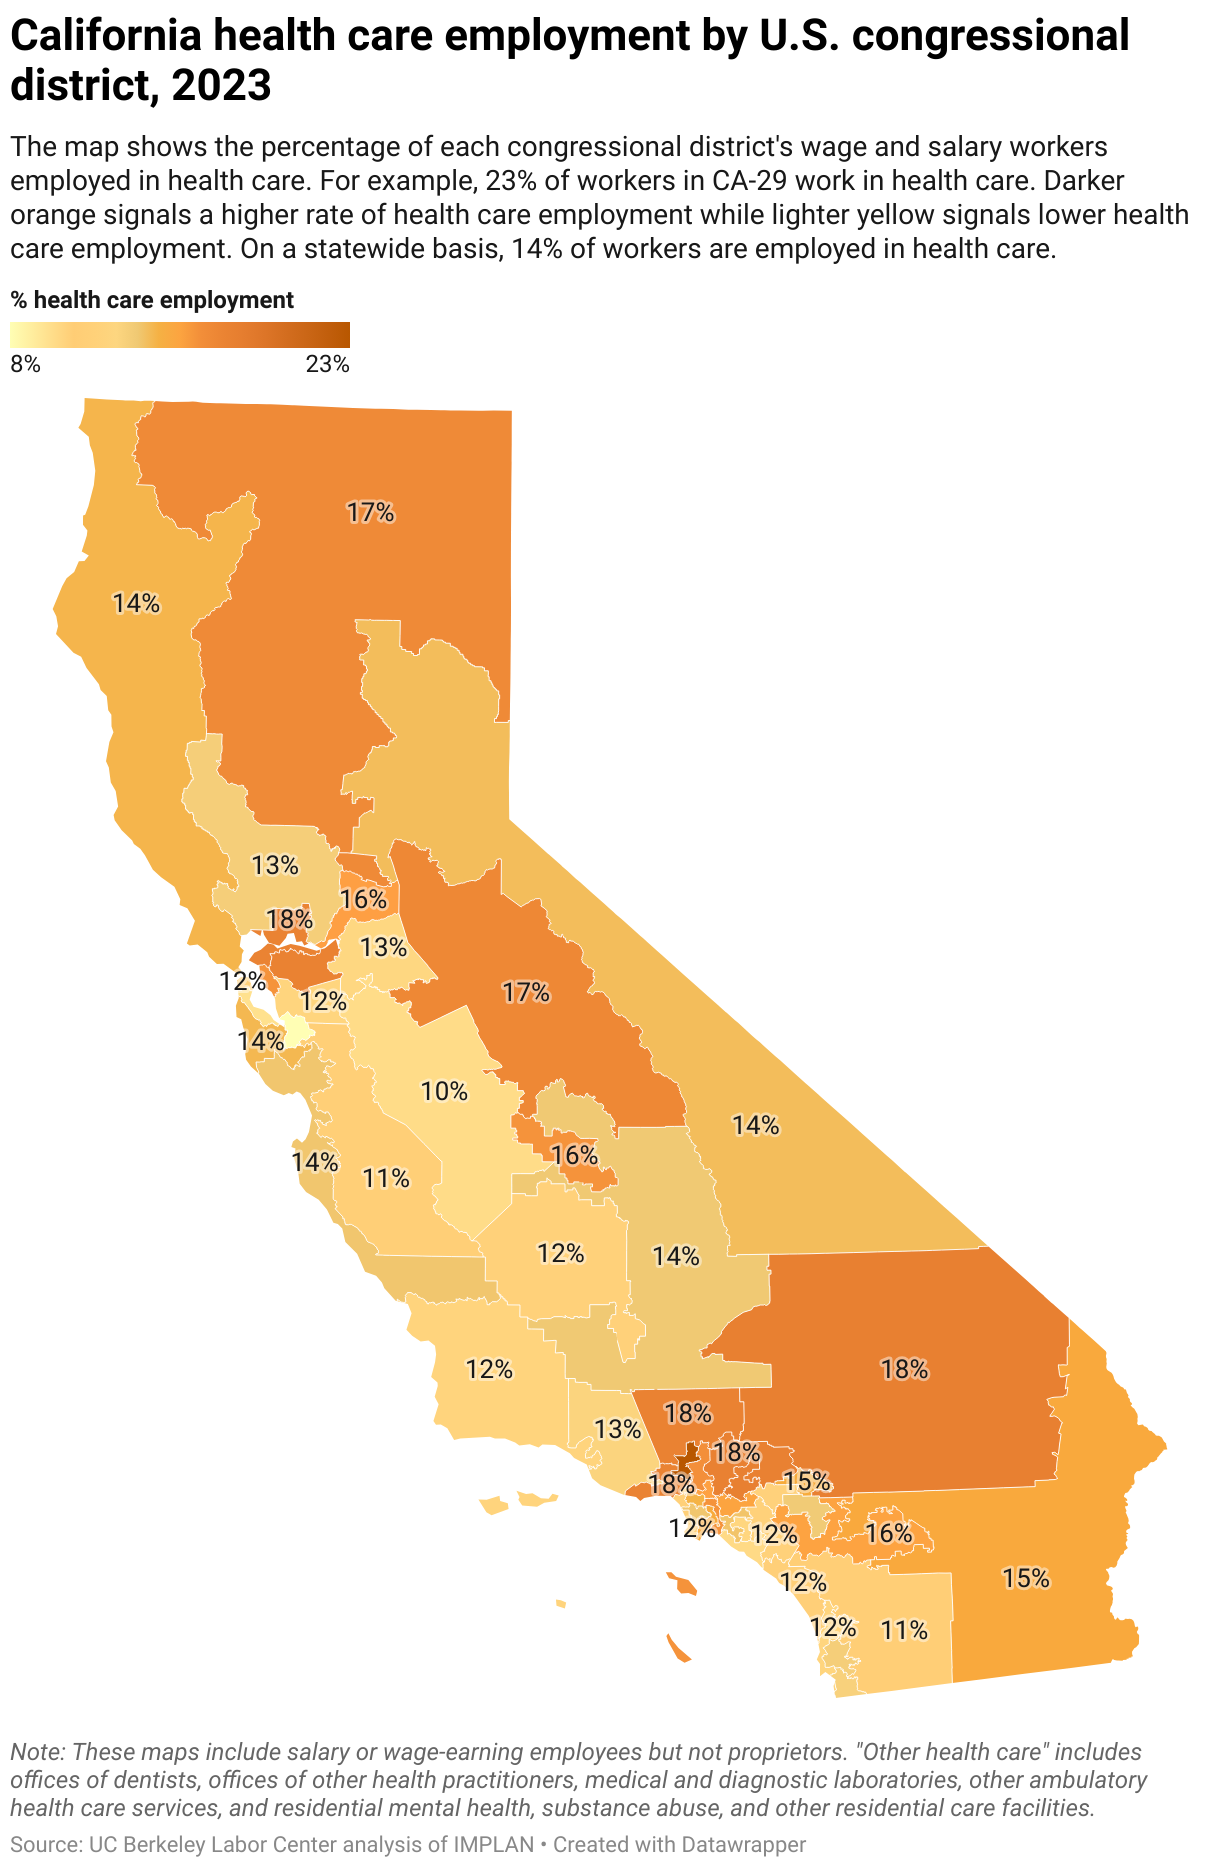
The map shows the percentage of each congressional district's wage and salary workers employed in health care. For example, 23% of workers in CA-29 work in health care. Darker orange signals a higher rate of health care employment while lighter yellow signals lower health care employment. On a statewide basis, 14% of workers are employed in health care.
This map of California shows the percentages of health care workers in each congressional district. The darker the district, the higher the percentage of health care workers. The percentages range from 8 - 23%. When hovering over each district, a text box also displays totals for the following: physician offices, clinics & other outpatient, hospitals, home care/home health, nursing homes & community care facilities, other health care, all health care employment, and total employment.
