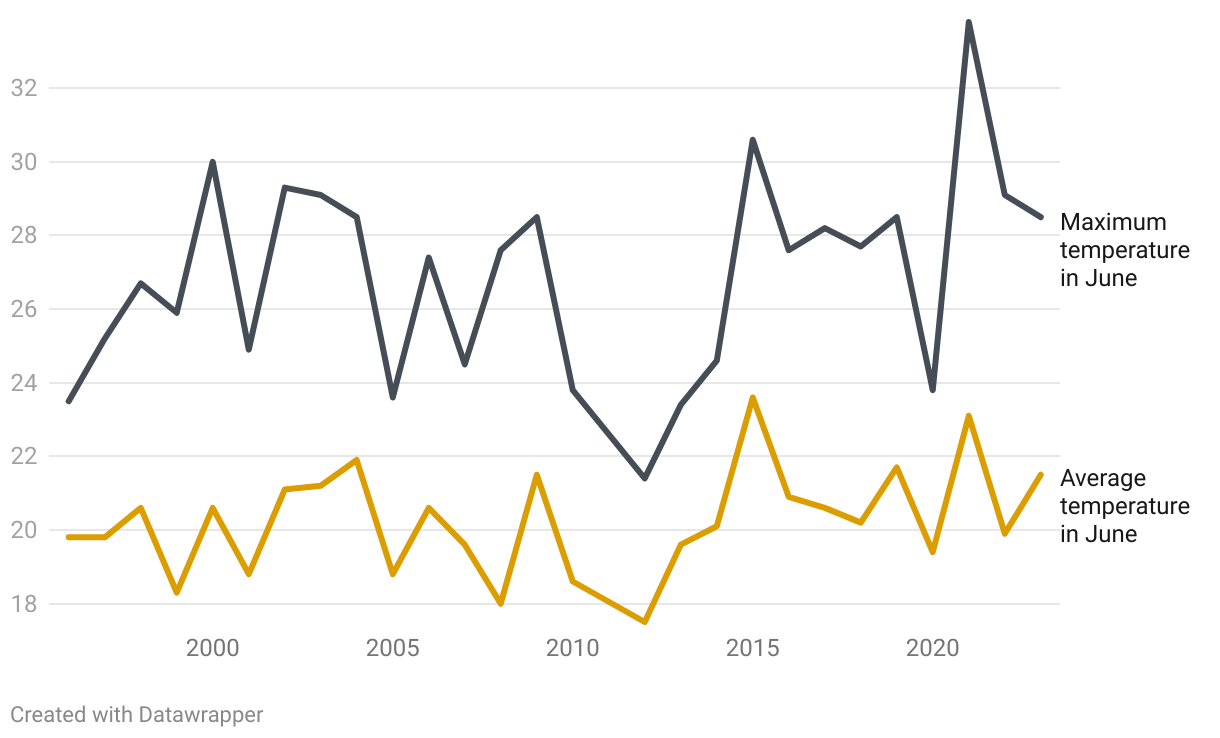
This graph shows the average and maximum temperatures in degrees Celsius for June over the past 27 years.
(Please use a modern browser to see the interactive version of this visualization)