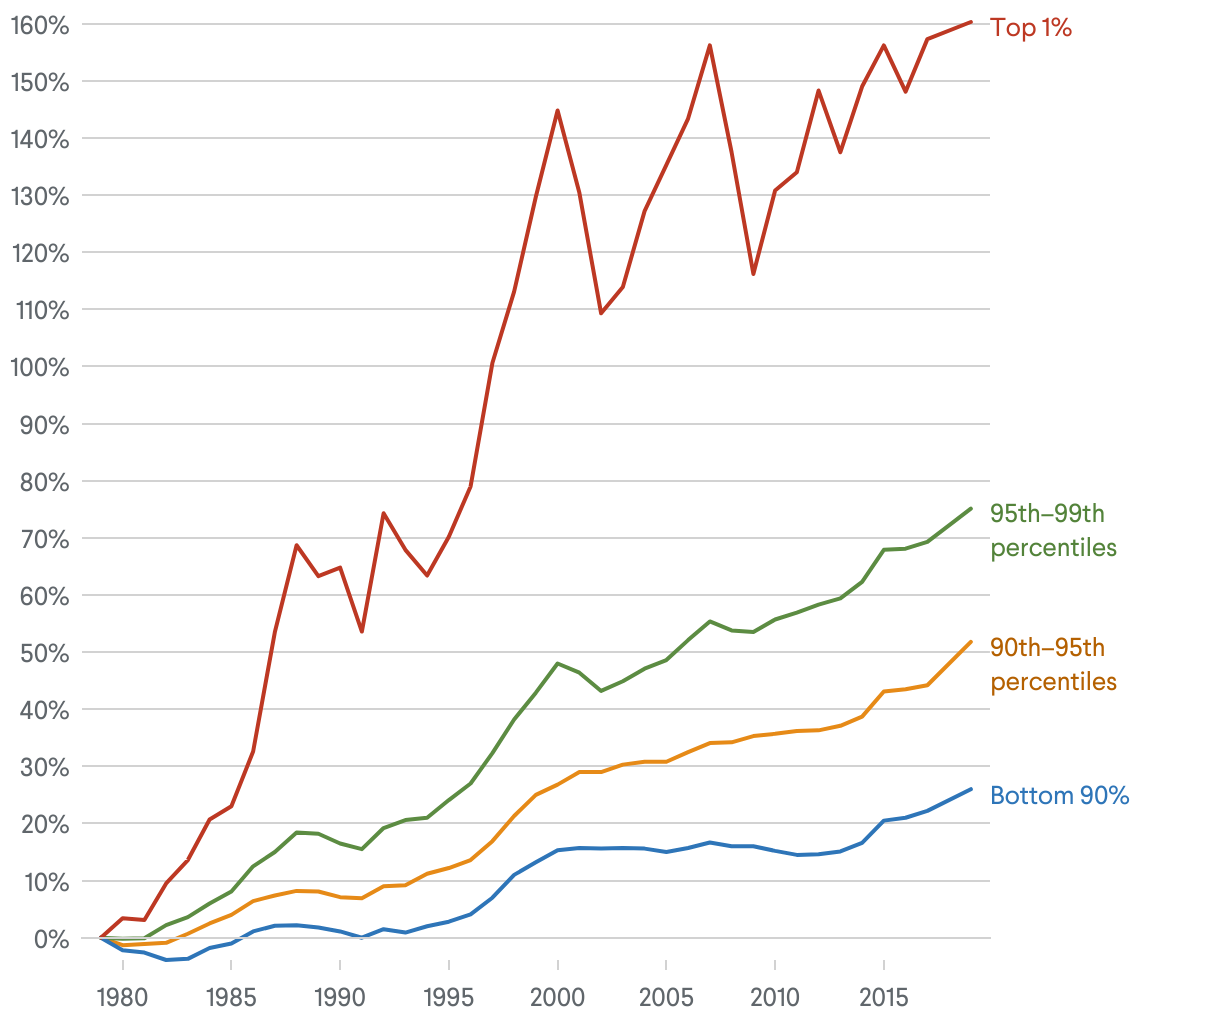
Income for the One Percent Has More Than Tripled Since 1979
Cumulative percent change in real annual wages, by wage group.
This line chart shows the cumulative percent change in annual wage by each wage group, the bottom 90%, the 90th–95th percentiles, the 95th–99th percentiles, and the top 1%. The data shows that from 1979 to 2019 income has more than tripled for the top 1%.