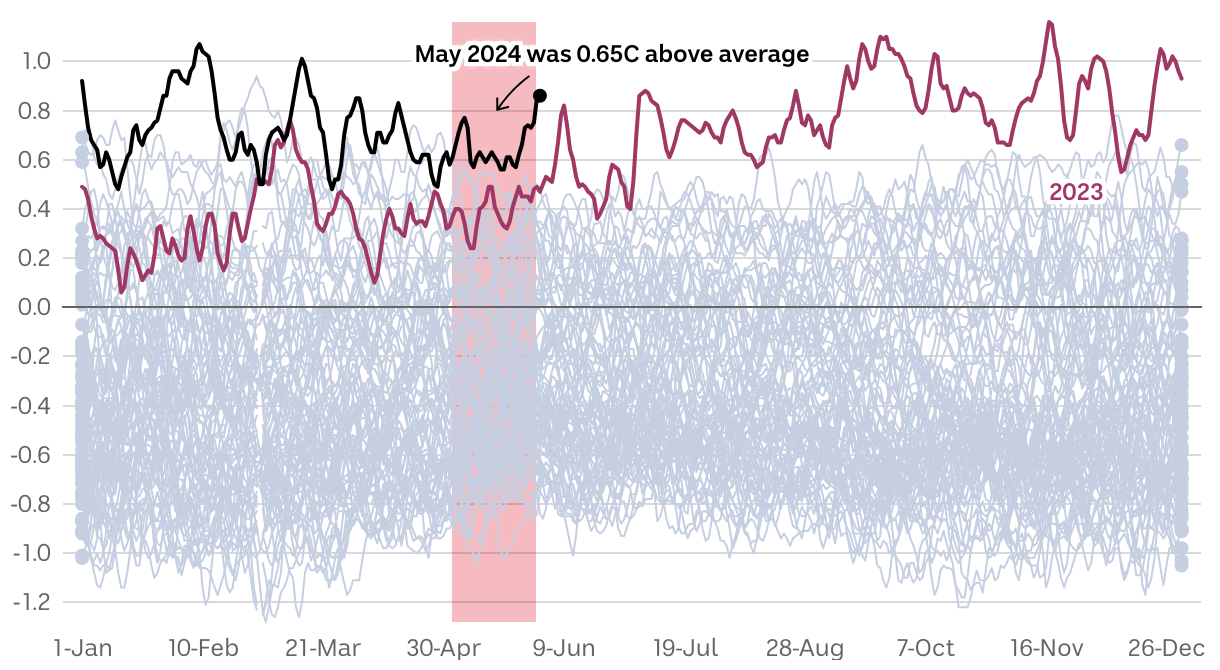
A line chart showing daily temperature anomalies
(Please use a modern browser to see the interactive version of this visualization)