Impacts on imports by agrifood product
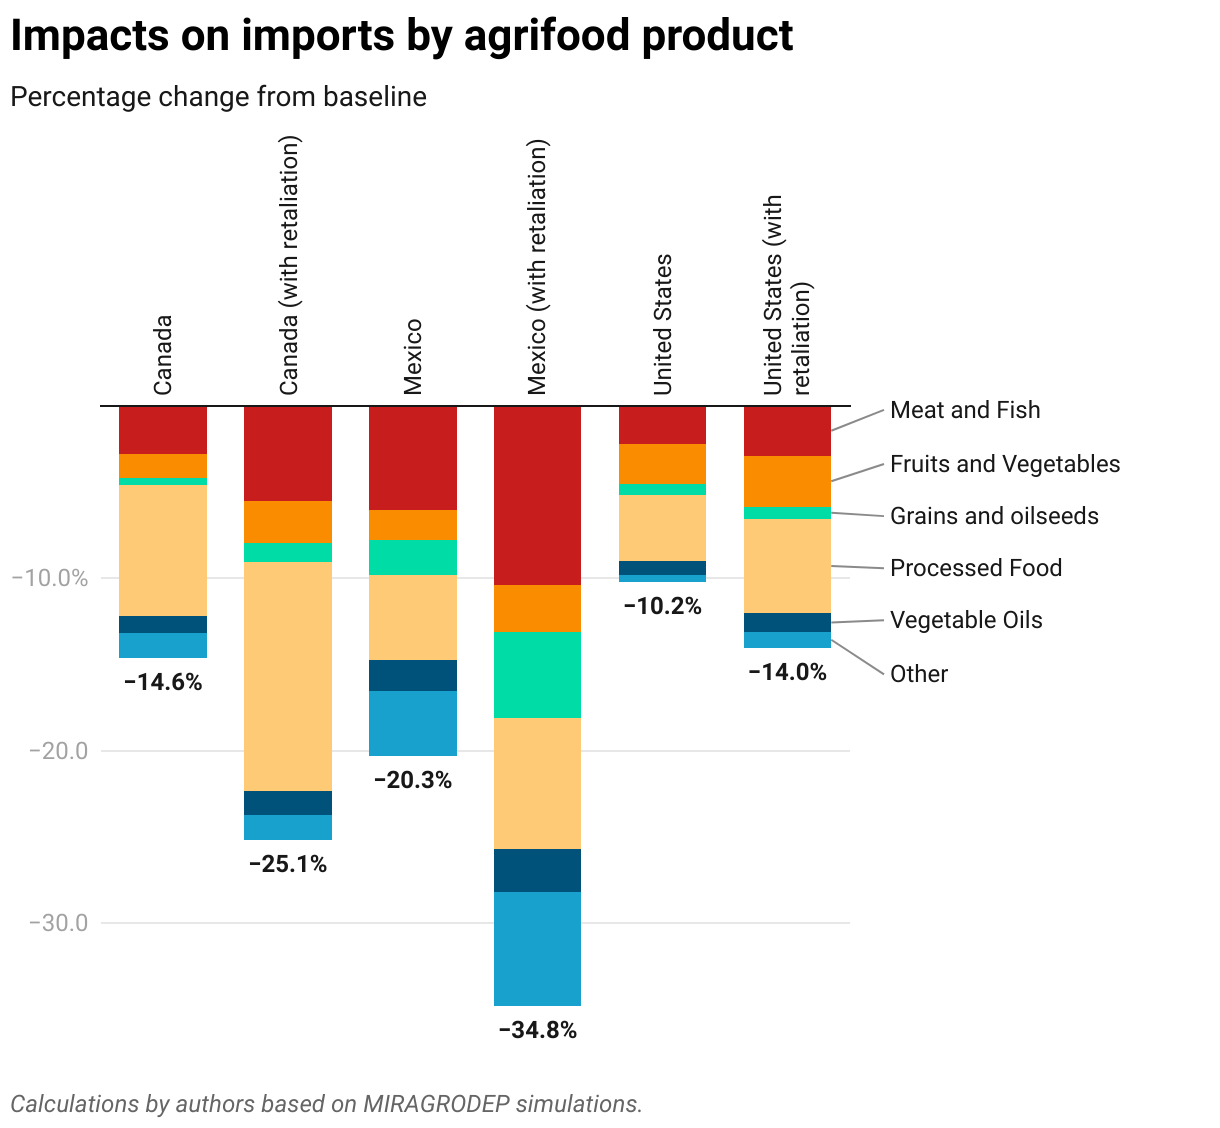
Percentage change from baseline
−30.0
−20.0
−10.0%
0.0
−2.8%
−1.4%
−0.4%
−7.6%
−1.0%
−1.4%
−5.5%
−2.4%
−1.1%
−13.3%
−1.4%
−1.4%
−6.1%
−1.7%
−2.0%
−5.0%
−1.8%
−3.8%
−10.4%
−2.7%
−5.0%
−7.6%
−2.5%
−6.6%
−2.2%
−2.3%
−0.6%
−3.9%
−0.8%
−0.4%
−2.9%
−3.0%
−0.7%
−5.5%
−1.1%
−0.9%
−14.6%
−25.1%
−20.3%
−34.8%
−10.2%
−14.0%
Canada
Canada (with retaliation)
Mexico
Mexico (with retaliation)
United States
United States (with retaliation)
Meat and Fish
Fruits and Vegetables
Grains and oilseeds
Processed Food
Vegetable Oils
Other