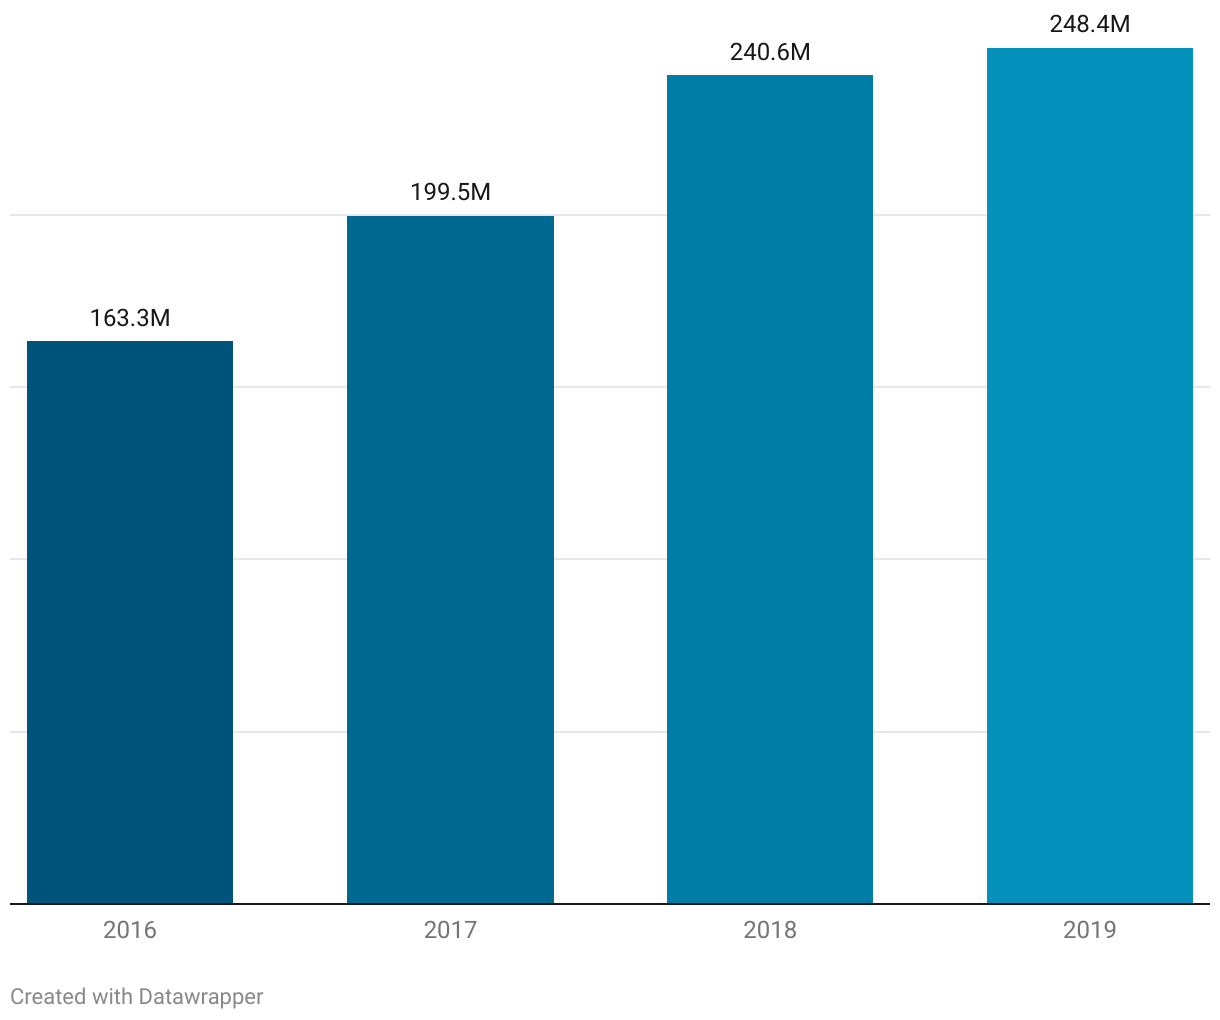
CVG Fuel (gallons) Throughput Served by Pipeline, 2016-2019
The chart contains four columns to show the total fuel throughput served by pipeline to CVG in gallons, 2016 to 2019.
(Please use a modern browser to see the interactive version of this visualization)