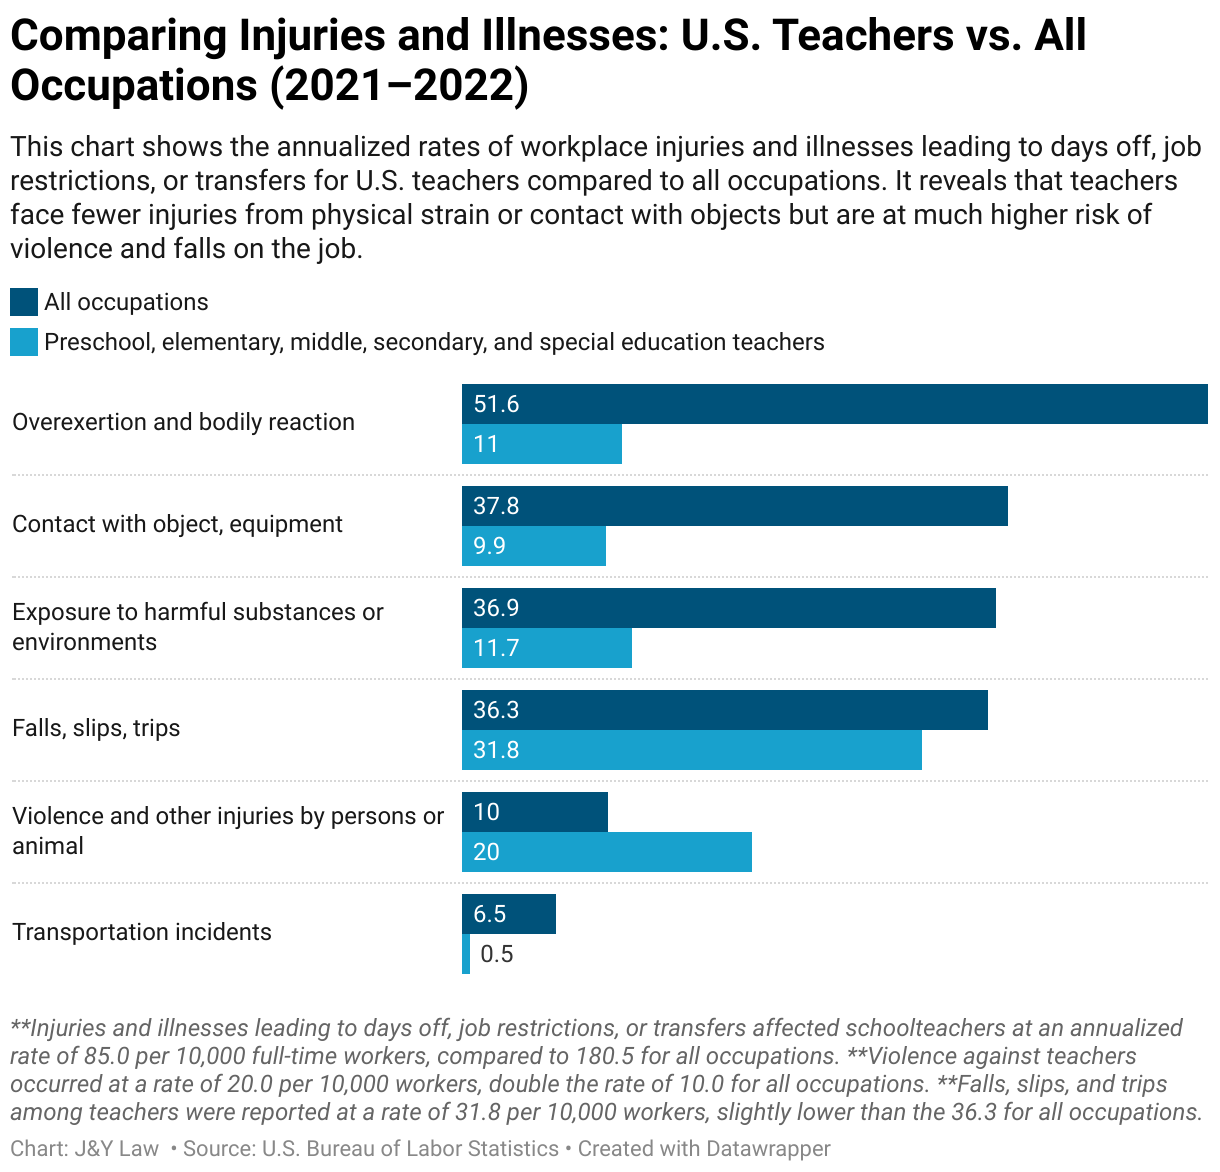
Comparing Injuries and Illnesses: U.S. Teachers vs. All Occupations (2021–2022)
This chart shows the annualized rates of workplace injuries and illnesses leading to days off, job restrictions, or transfers for U.S. teachers compared to all occupations. It reveals that teachers face fewer injuries from physical strain or contact with objects but are at much higher risk of violence and falls on the job.
