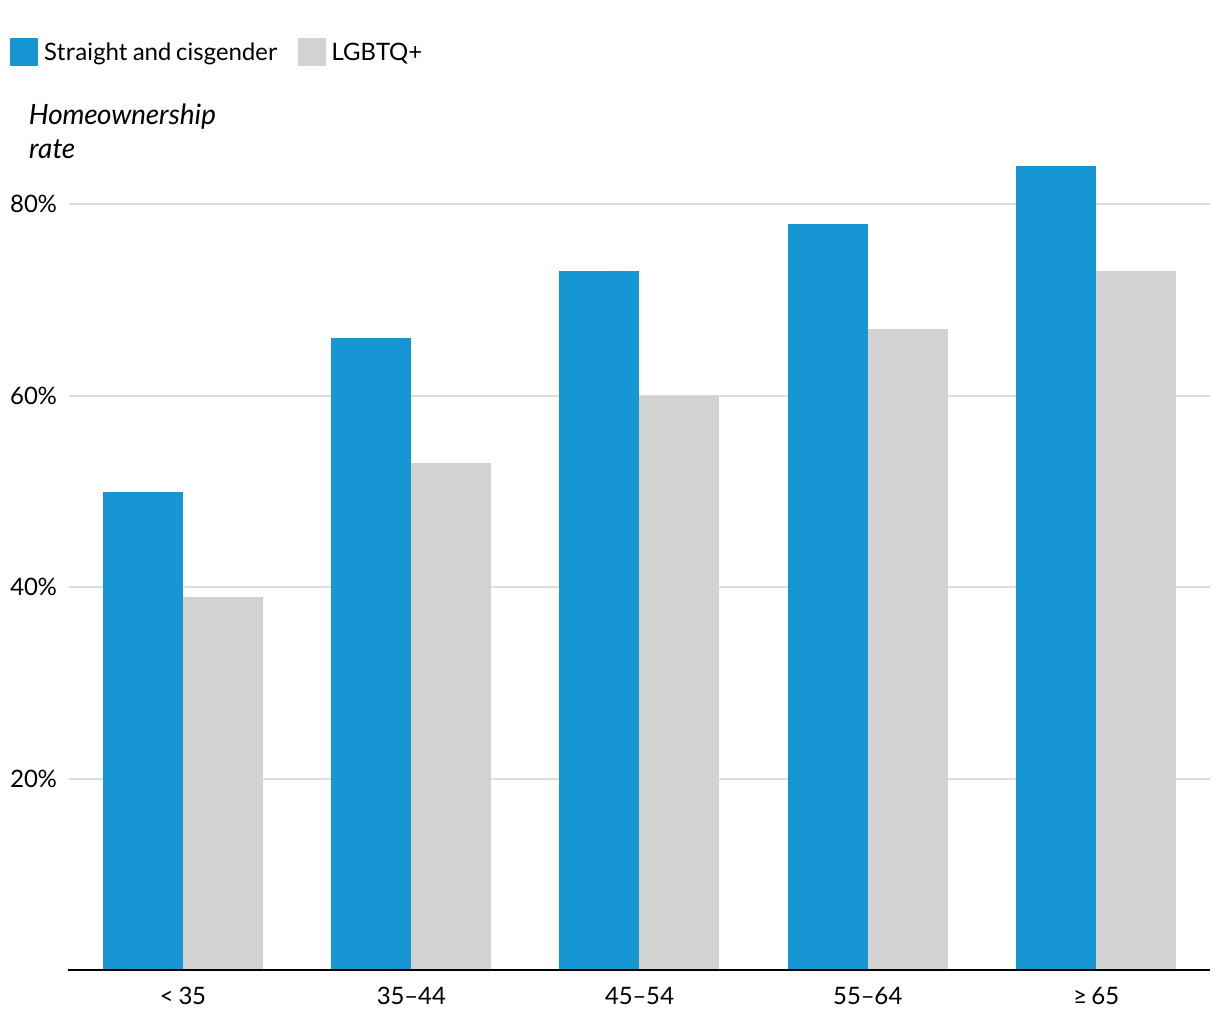
Grouped bar chart showing that age gaps between the LGBTQ+ and non-LGBTQ+ populations could be responsible for some of the homeownership between the two groups
(Please use a modern browser to see the interactive version of this visualization)