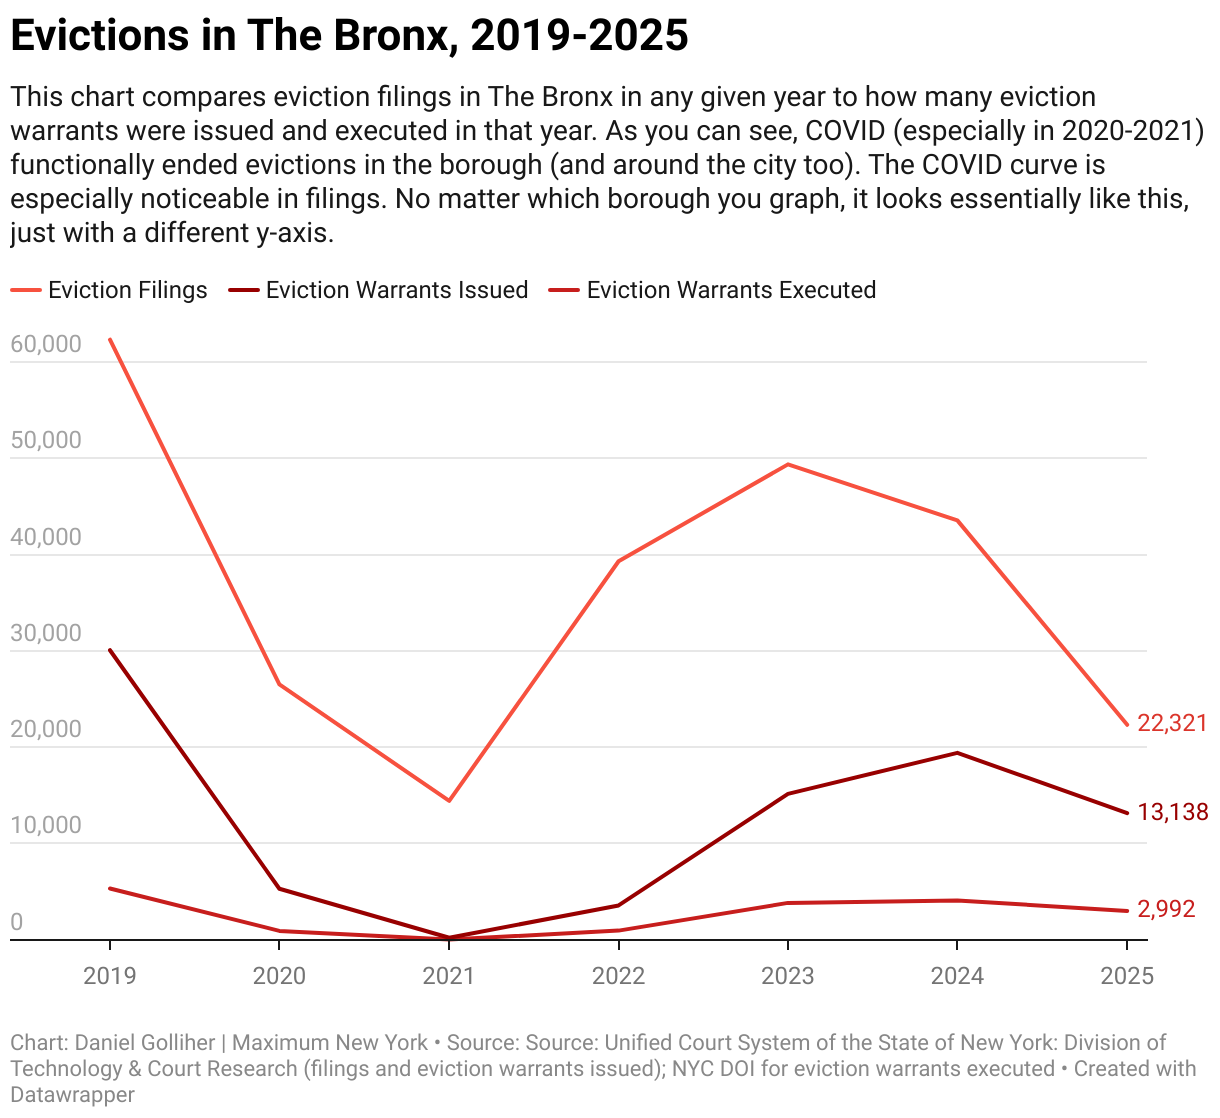
Evictions in The Bronx, 2019-2025
This chart compares eviction filings in The Bronx in any given year to how many eviction warrants were issued and executed in that year. As you can see, COVID (especially in 2020-2021) functionally ended evictions in the borough (and around the city too). The COVID curve is especially noticeable in filings. No matter which borough you graph, it looks essentially like this, just with a different y-axis.
