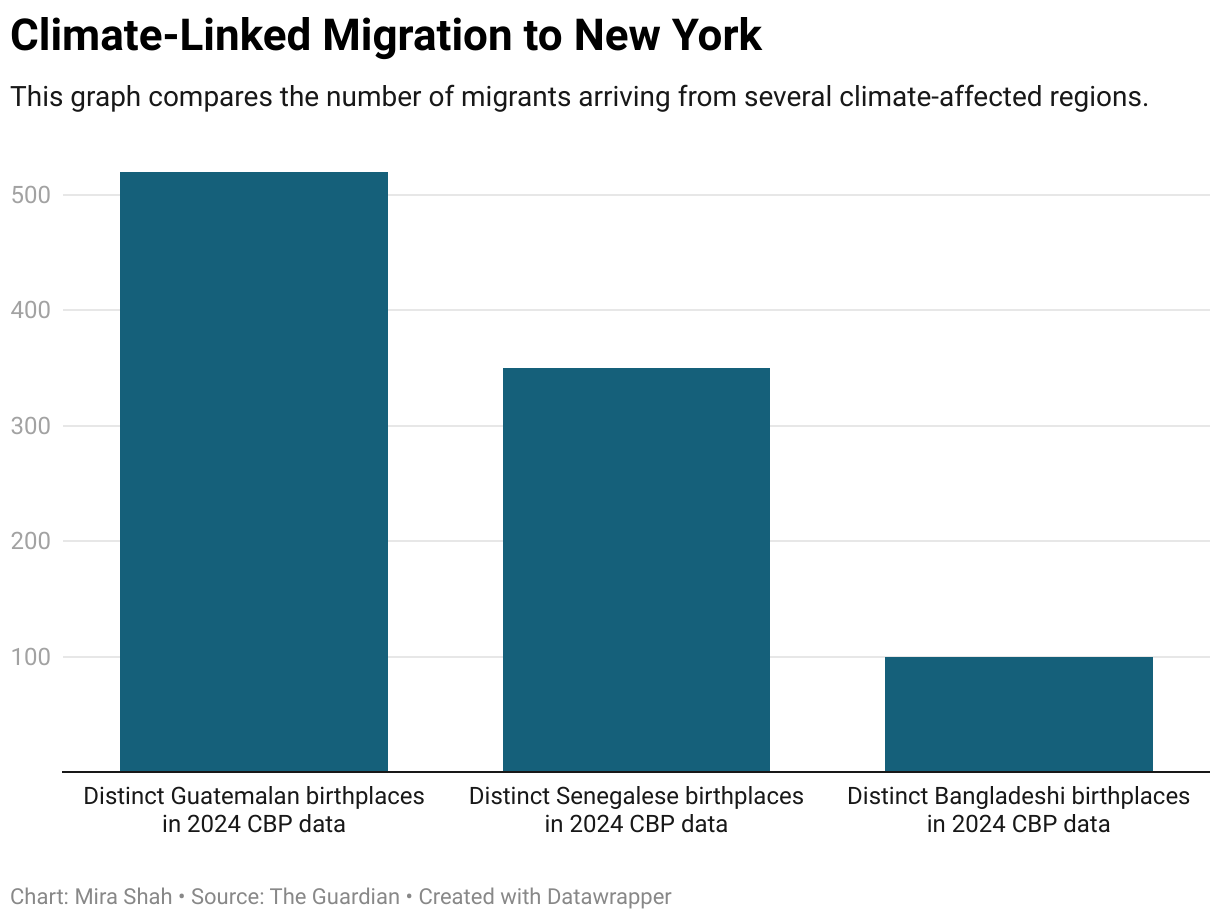
This graph compares the number of migrants arriving from several climate-affected regions.
(Please use a modern browser to see the interactive version of this visualization)
