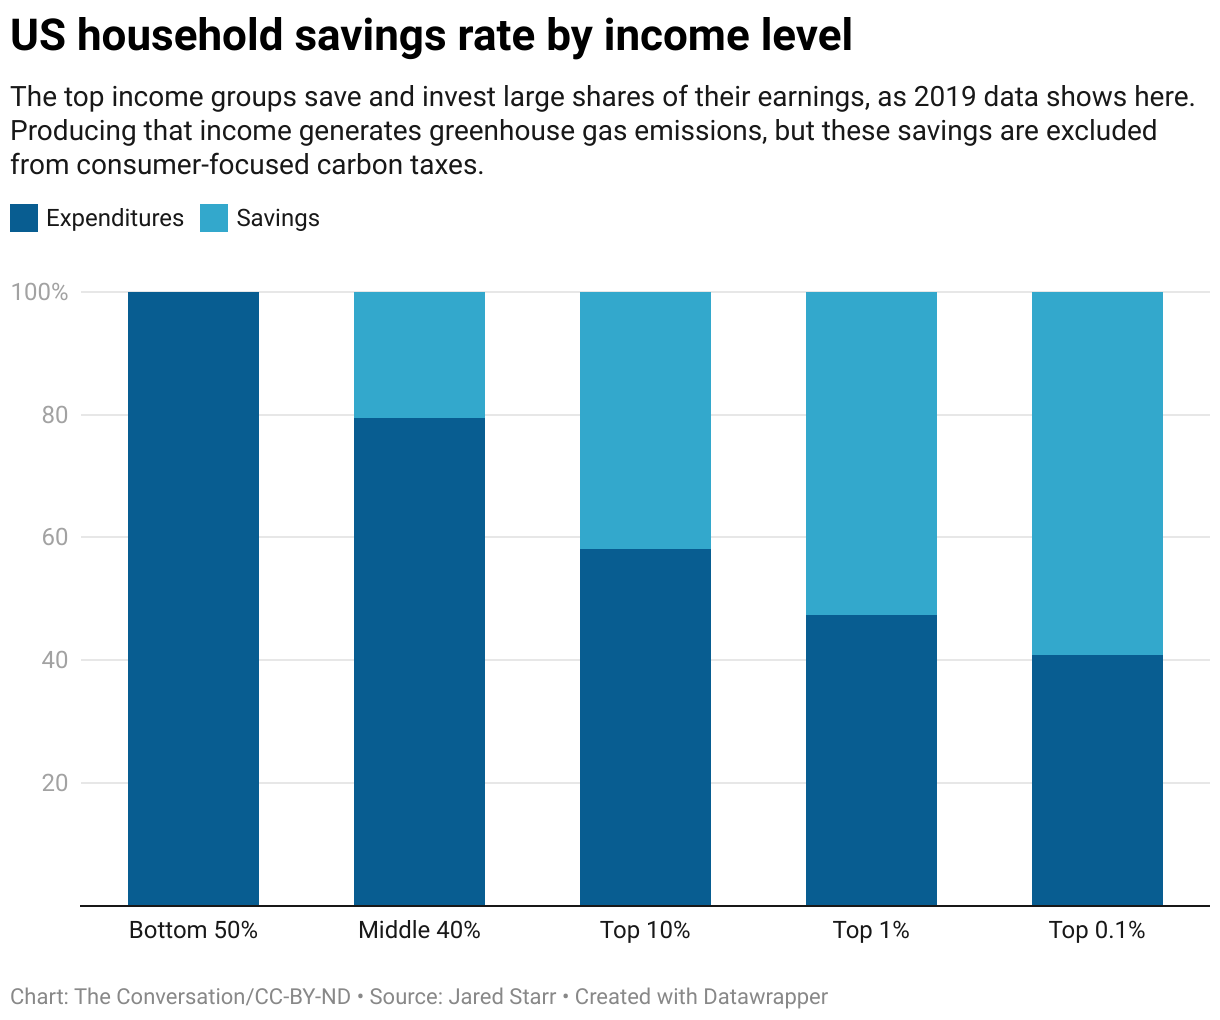
A chart shows the breakdown between savings and spending for each income class. The poorest 50% spend all of their income. The top 1% are able to invest more than half of theirs.
US household savings rate by income level
The top income groups save and invest large shares of their earnings, as 2019 data shows here. Producing that income generates greenhouse gas emissions, but these savings are excluded from consumer-focused carbon taxes.
