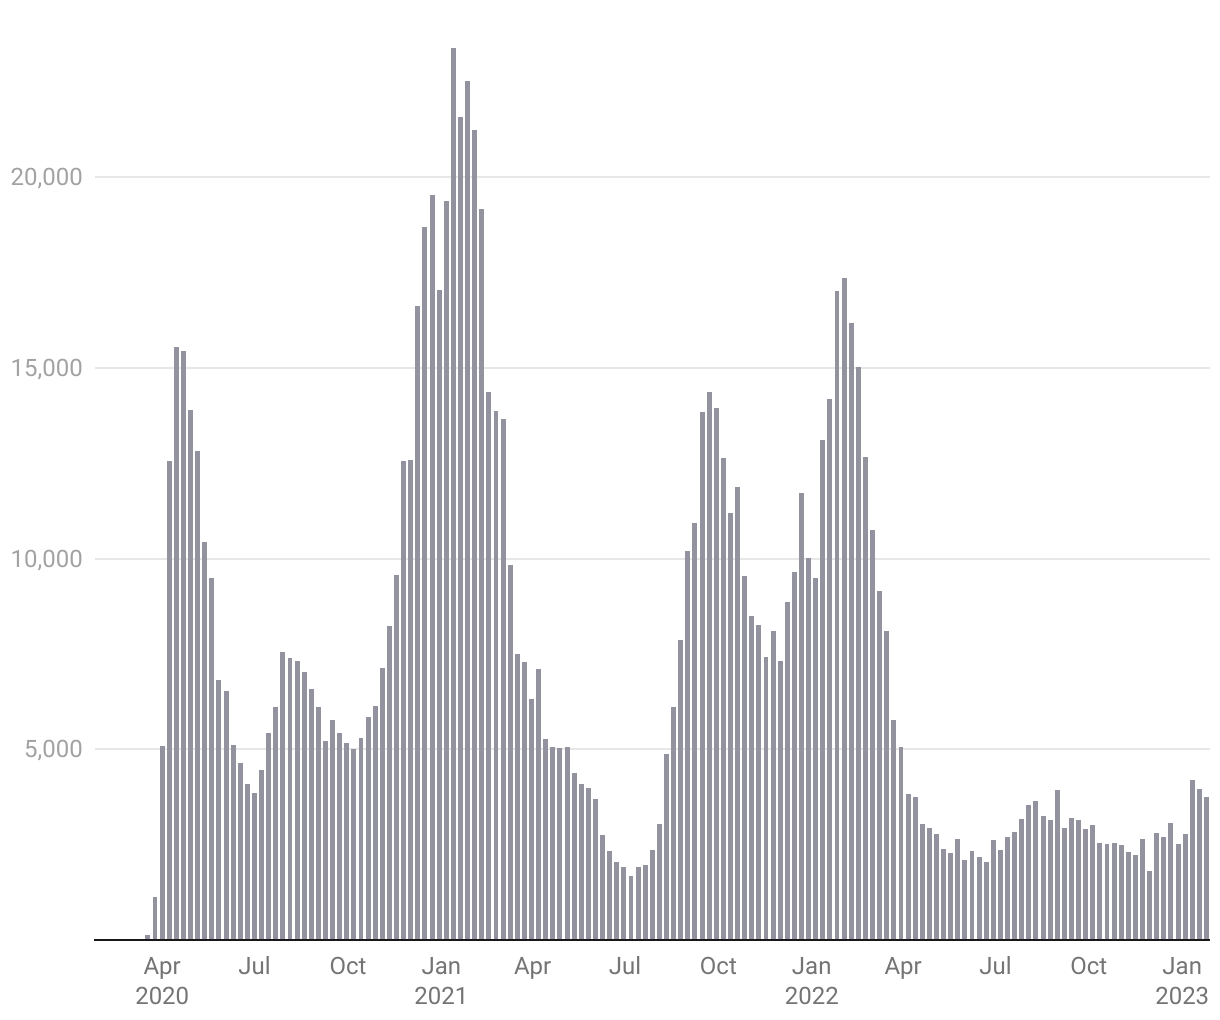
US COVID-19 deaths have leveled off
More than 1.1 million Americans had died of COVID-19 by the end of January 2023. The number of weekly deaths had remained below 4,500 for about nine months by that point, with no big spikes like those seen in April and May 2020, the winter of 2020-2021 or the fall and winter of 2021-2022.
Bar chart showing spikes followed by flatlining