Monthly Estimates of Investors' Willingness to Pay for ESG Funds
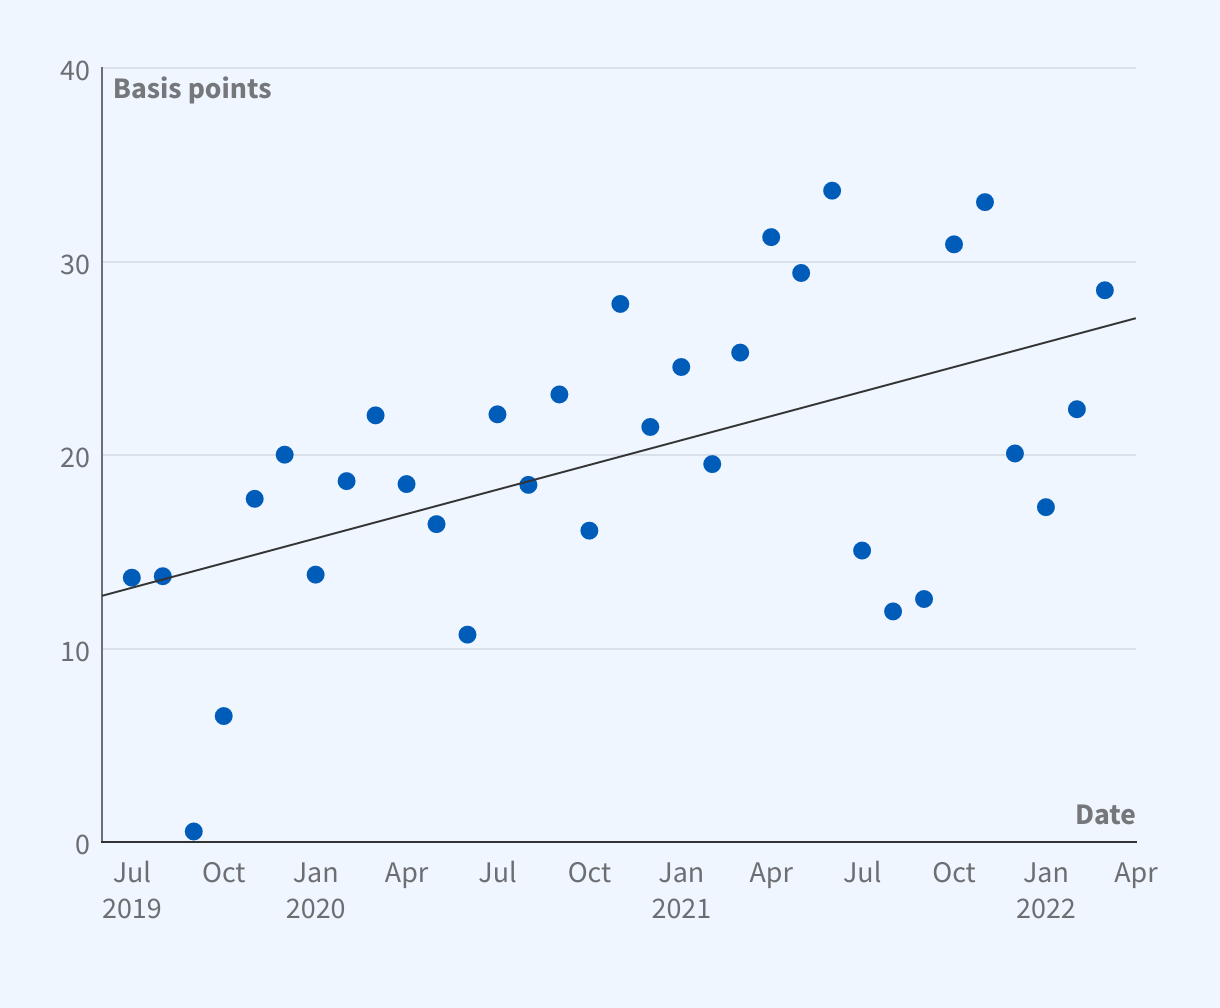
The graph is a scatterplot titled, “Monthly Estimates of Investors’ Willingness to Pay for ESG Funds.”
The y-axis ranges 0 to 40 basis points, and the x-axis ranges from July 2019 to March 2022. The monthly estimates of investors’ willing to pay (WTP) increase over time, with an average WTP of about 20 basis points over the period.
Source: Researcher's calculations using data from the BLS and O*Net database