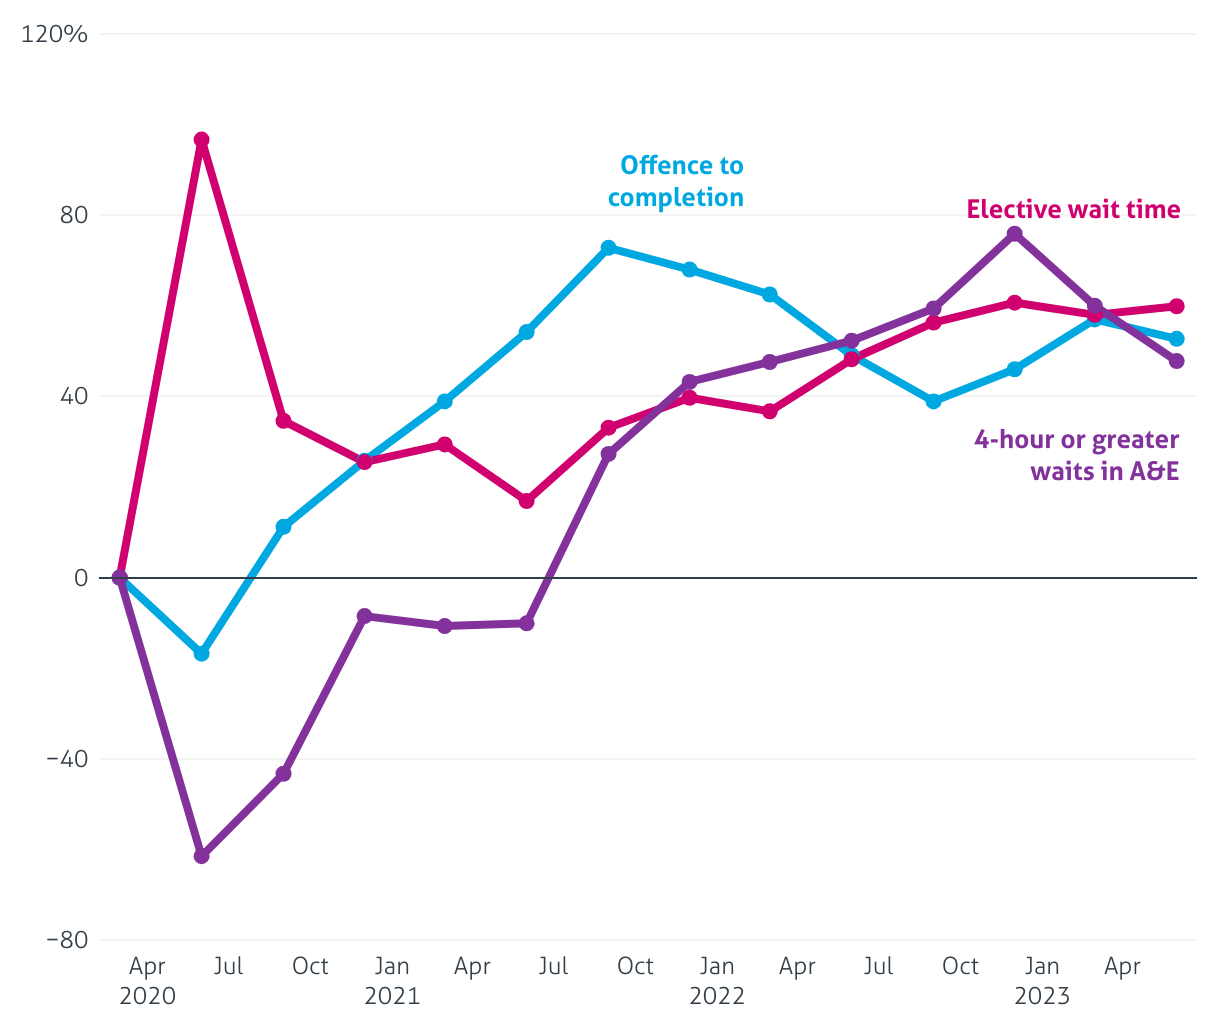
Change in hospital and criminal justice system waits/processing time since Q1 2020
A line chart from the Institute for Government of the change in wait times for a completed trial, elective care, and A&Es between March 2020 and June 2023 where all waits are substantially (>40%) higher at the end of the period than the beginning.