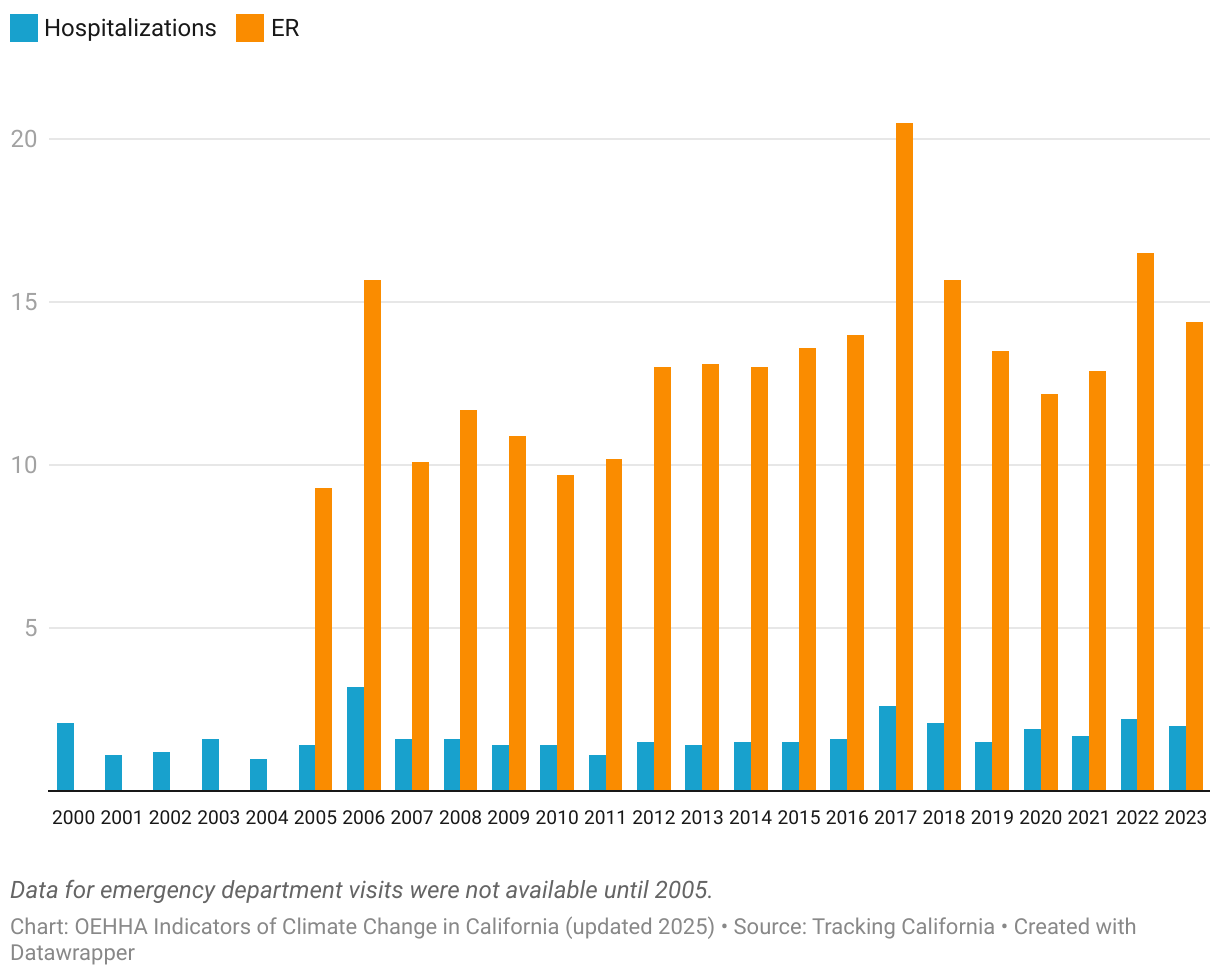
This graph shows reported hospitalizations and emergency department visits from May to September.
(Please use a modern browser to see the interactive version of this visualization)
