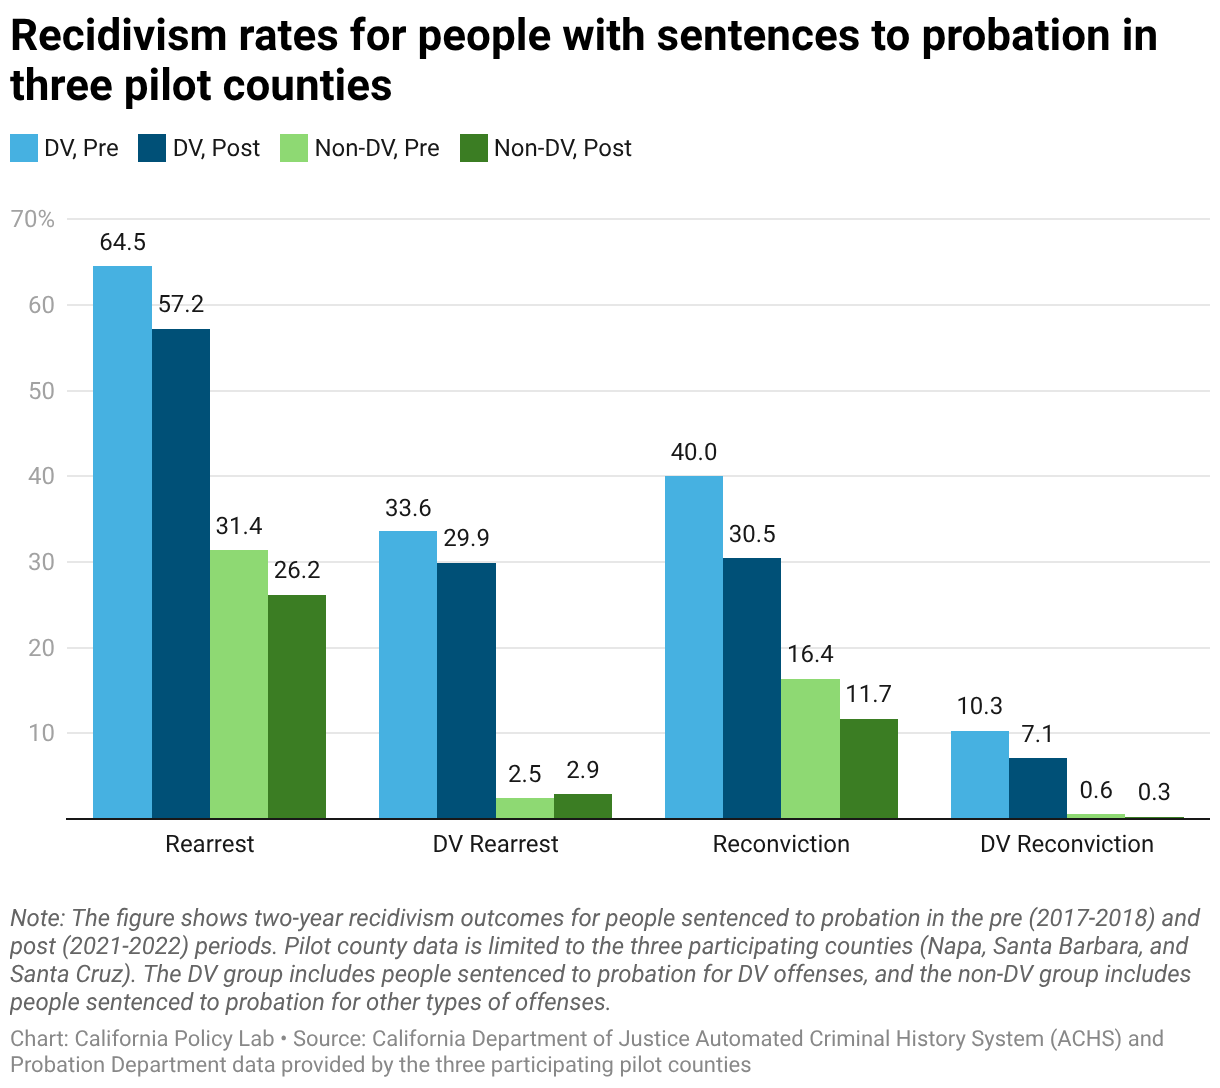
Recidivism rates for people with sentences to probation in three pilot counties
A bar chart comparing two-year recidivism rates across four outcomes: rearrest, DV rearrest, reconviction, and DV reconviction. Each category features four clustered bars tracking pre- and post- periods for the DV group and the Non-DV group. Overall, percentages decrease from pre to post across almost all groups and outcomes, and the recidivism rates for the DV group are also consistently higher than the non-DV group for both the pre and post period.