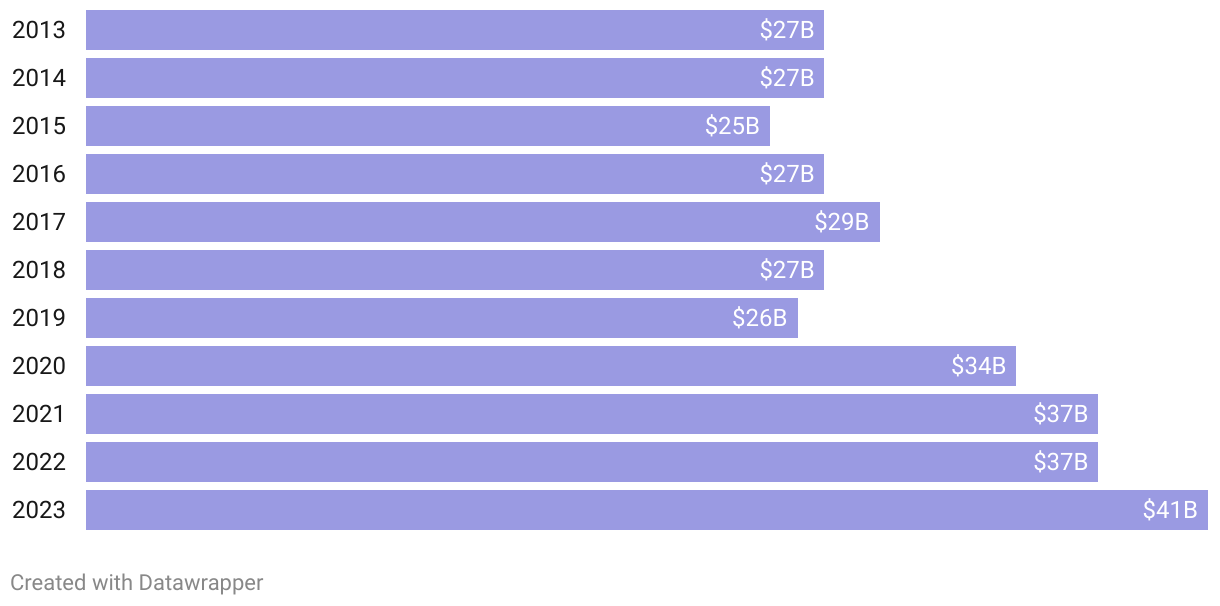
A horizontal bar chart shows the years on the left and in the bars, the total expected spending levels.
(Please use a modern browser to see the interactive version of this visualization)