Undefined Centers
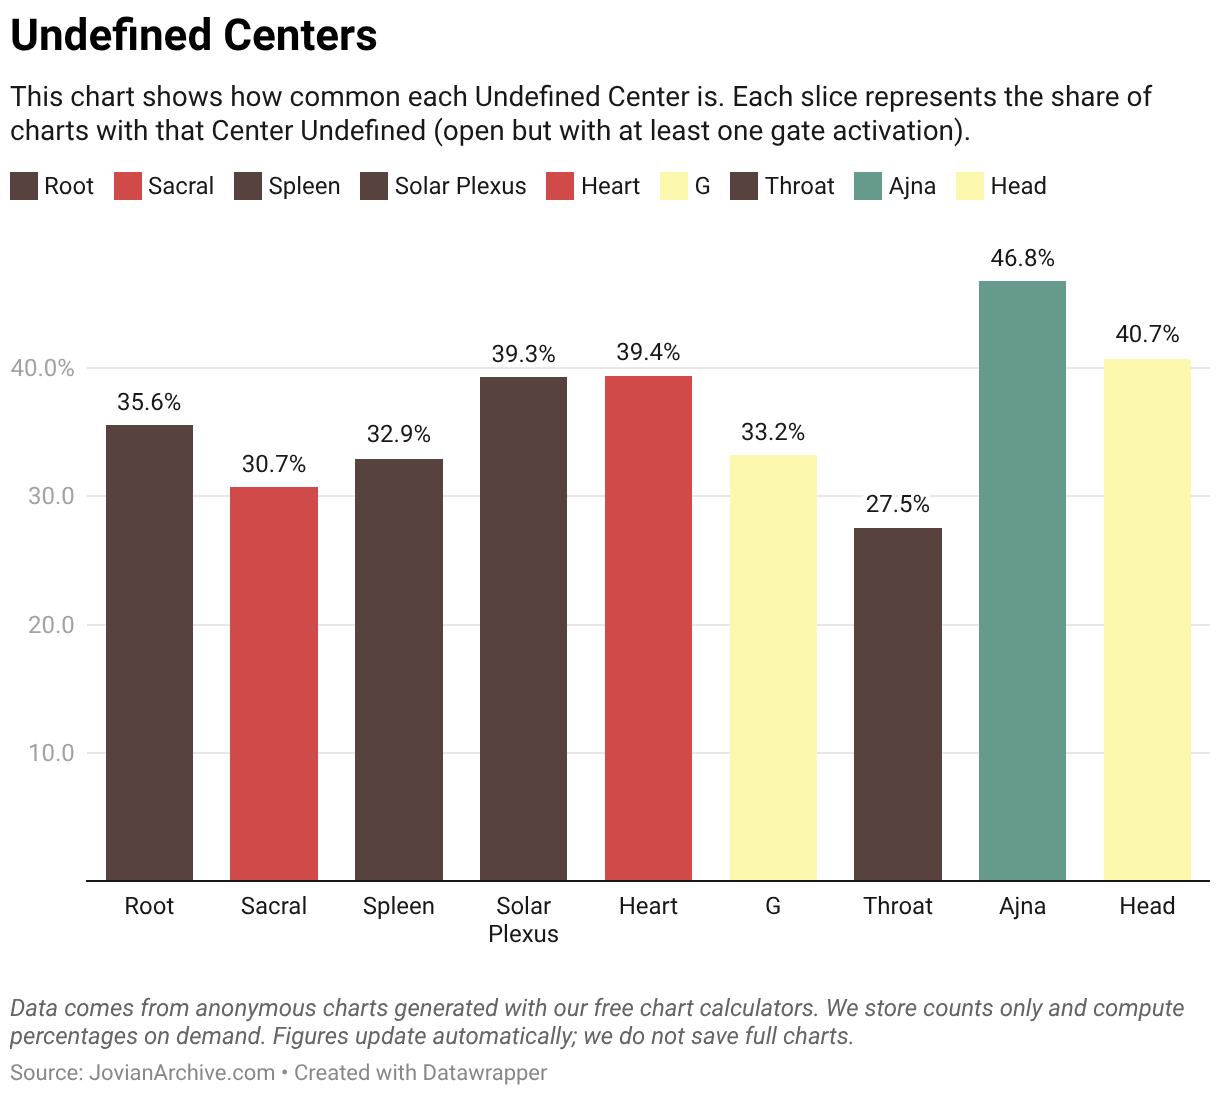
This chart shows how common each Undefined Center is. Each slice represents the share of charts with that Center Undefined (open but with at least one gate activation).
This chart shows how common each Undefined Center is. Each slice represents the share of charts with that Center Undefined (open but with at least one gate activation).
