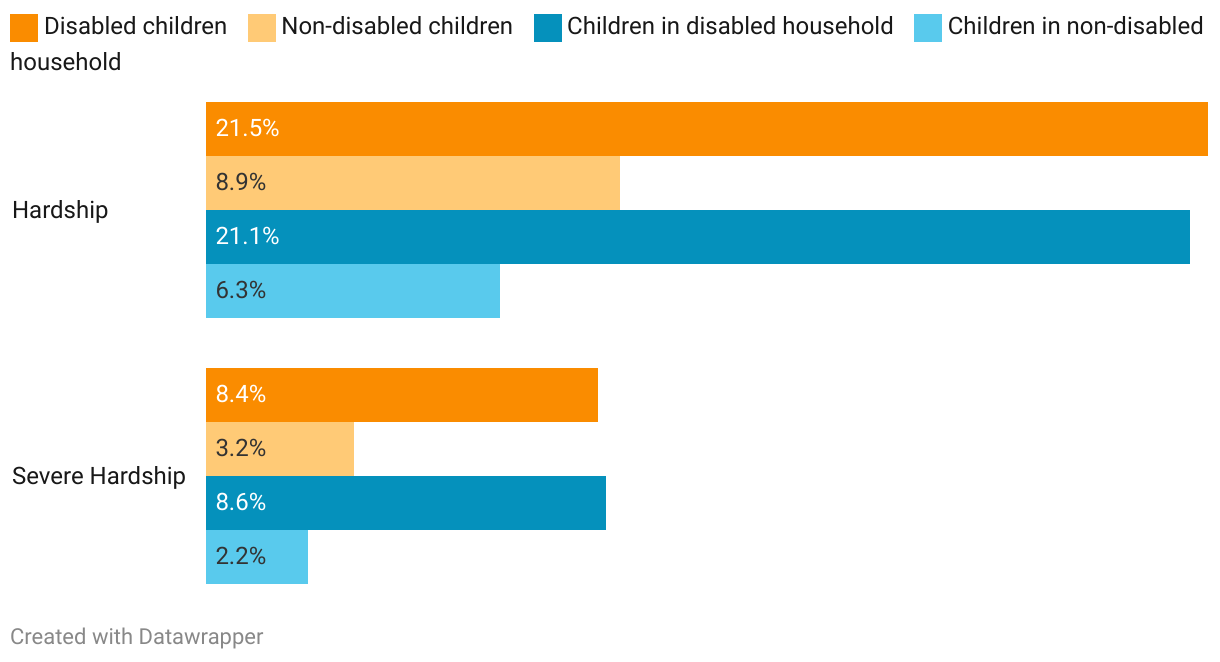
NZ Rates of Children Living in Material Hardship, by Disability Status, 2022
Rates of hardship are much higher for disabled children (21.5%) and children in a disabled household (21.1%) than for non-disabled children (8.9%) and children in a non-disabled household (6.3%). Similar patterns for severe hardship