Map Visualization on Daily Average Income Class per Region in Philippines last 2021
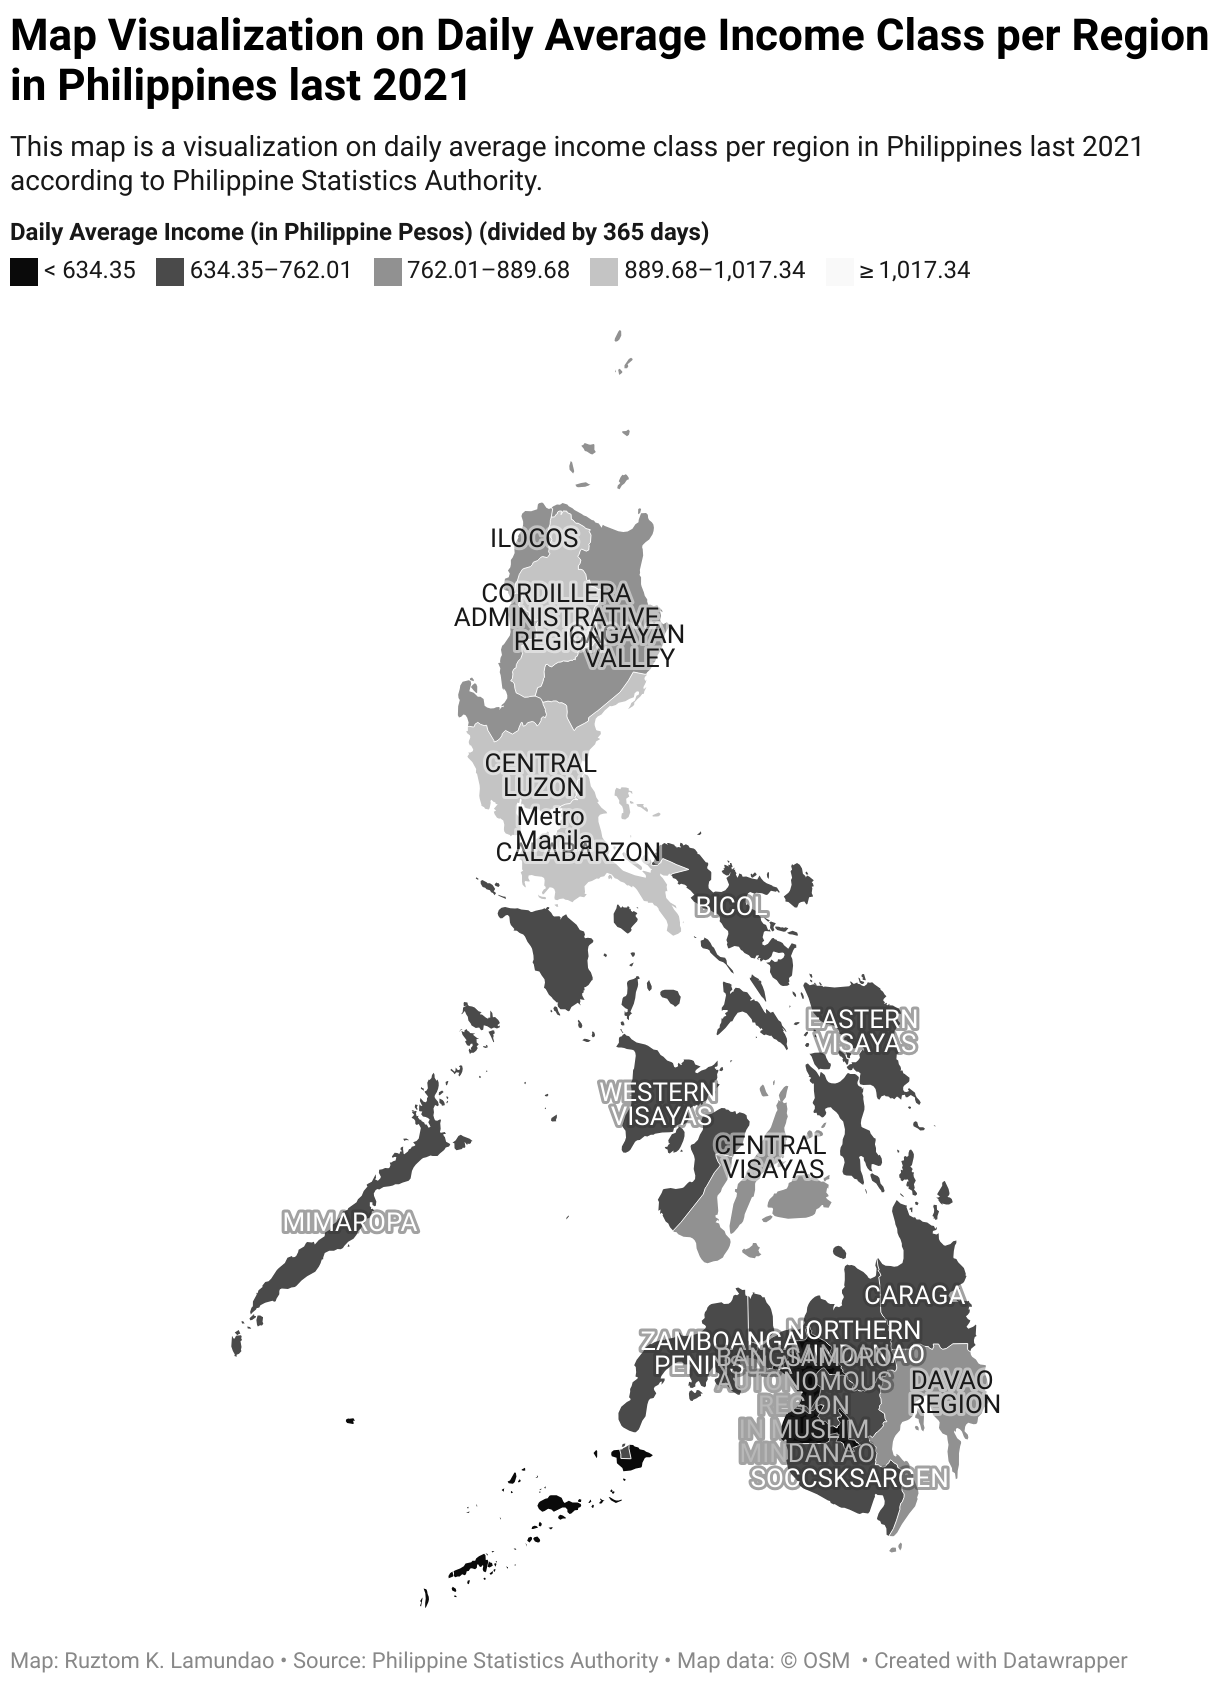
This map is a visualization on daily average income class per region in Philippines last 2021 according to Philippine Statistics Authority.
Here are the data for map visualization on daily average income class per region in this country last 2021:
Region Daily Average Income (in Philippine Pesos) (divided by 365 days) Annual Average Income (in Philippine Pesos) Monthly Average Income (in Philippine Pesos)
Metro Manila 1145 417850 34820.833333333336
CORDILLERA ADMINISTRATIVE REGION 960.08 350430 29202.5
ILOCOS 835.18 304840 25403.333333333332
CAGAYAN VALLEY 794.85 290120 24176.666666666668
CENTRAL LUZON 900.11 328540 27378.333333333332
CALABARZON 989.12 361030 30085.833333333332
MIMAROPA 698.85 255080 21256.666666666668
BICOL 690.44 252010 21000.833333333332
WESTERN VISAYAS 733.64 267780 22315
CENTRAL VISAYAS 780.52 284890 23740.833333333332
EASTERN VISAYAS 665.56 242930 20244.166666666668
ZAMBOANGA PENINSULA 653.59 238560 19880
NORTHERN MINDANAO 705.37 257460 21455
DAVAO REGION 772.27 281880 23490
SOCCSKSARGEN 642.96 234680 19556.666666666668
CARAGA 684.30 249770 20814.166666666668
BANGSAMORO AUTONOMOUS REGION IN MUSLIM MINDANAO 506.69 184940 15411.666666666666
