Defined Centers
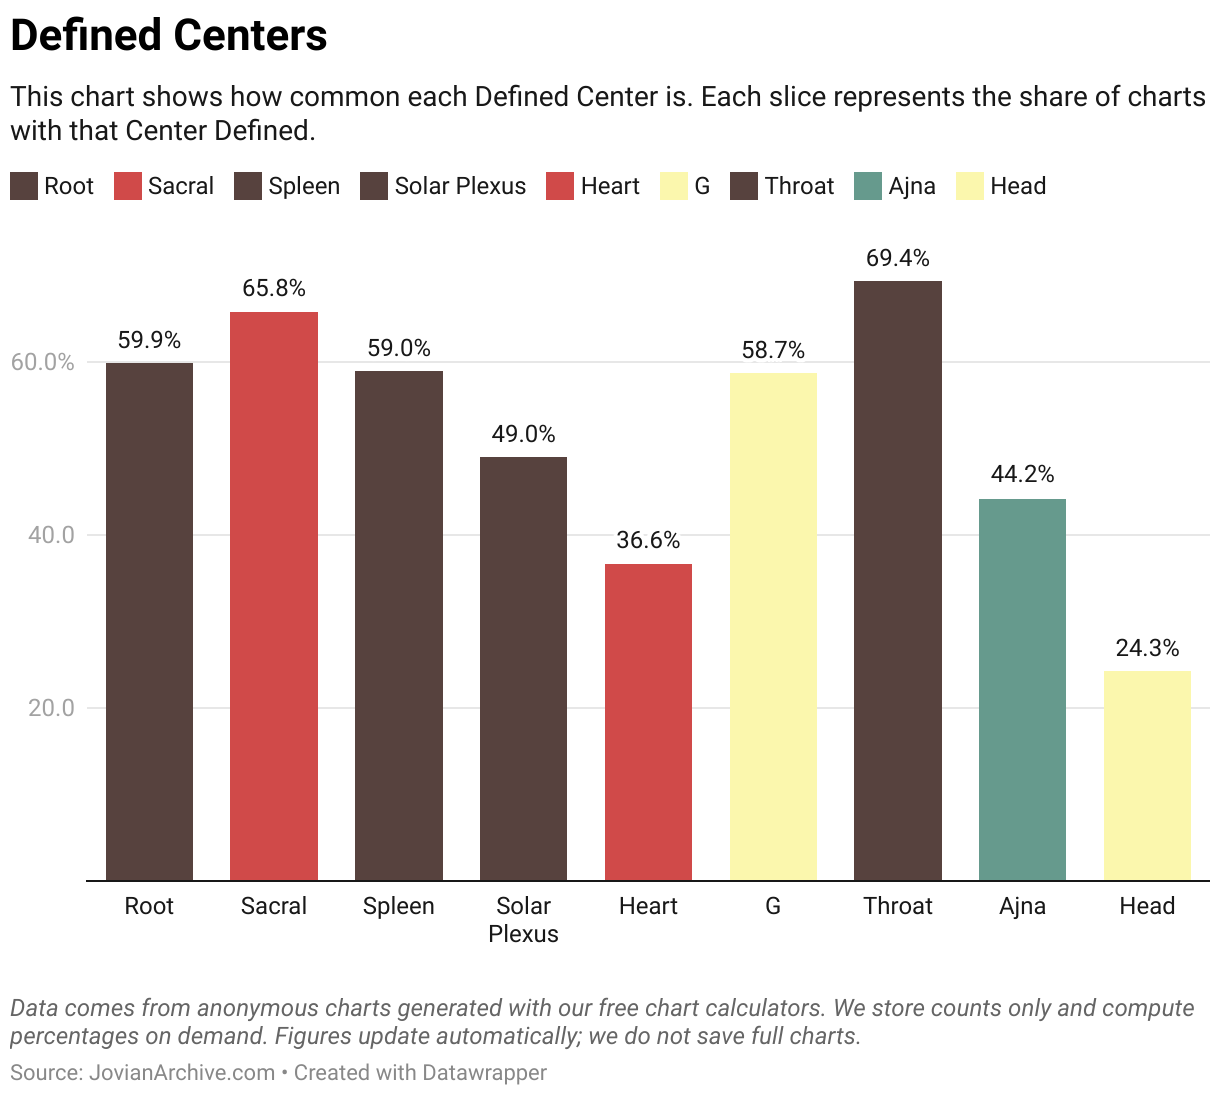
This chart shows how common each Defined Center is. Each slice represents the share of charts with that Center Defined.
This chart shows how common each Defined Center is. Each slice represents the share of charts with that Center Defined.
