Private Equity Acquisition of Airports and Passenger Volume
Difference in number of passengers per flight between PE and
government-owned airports, relative to year before acquisition
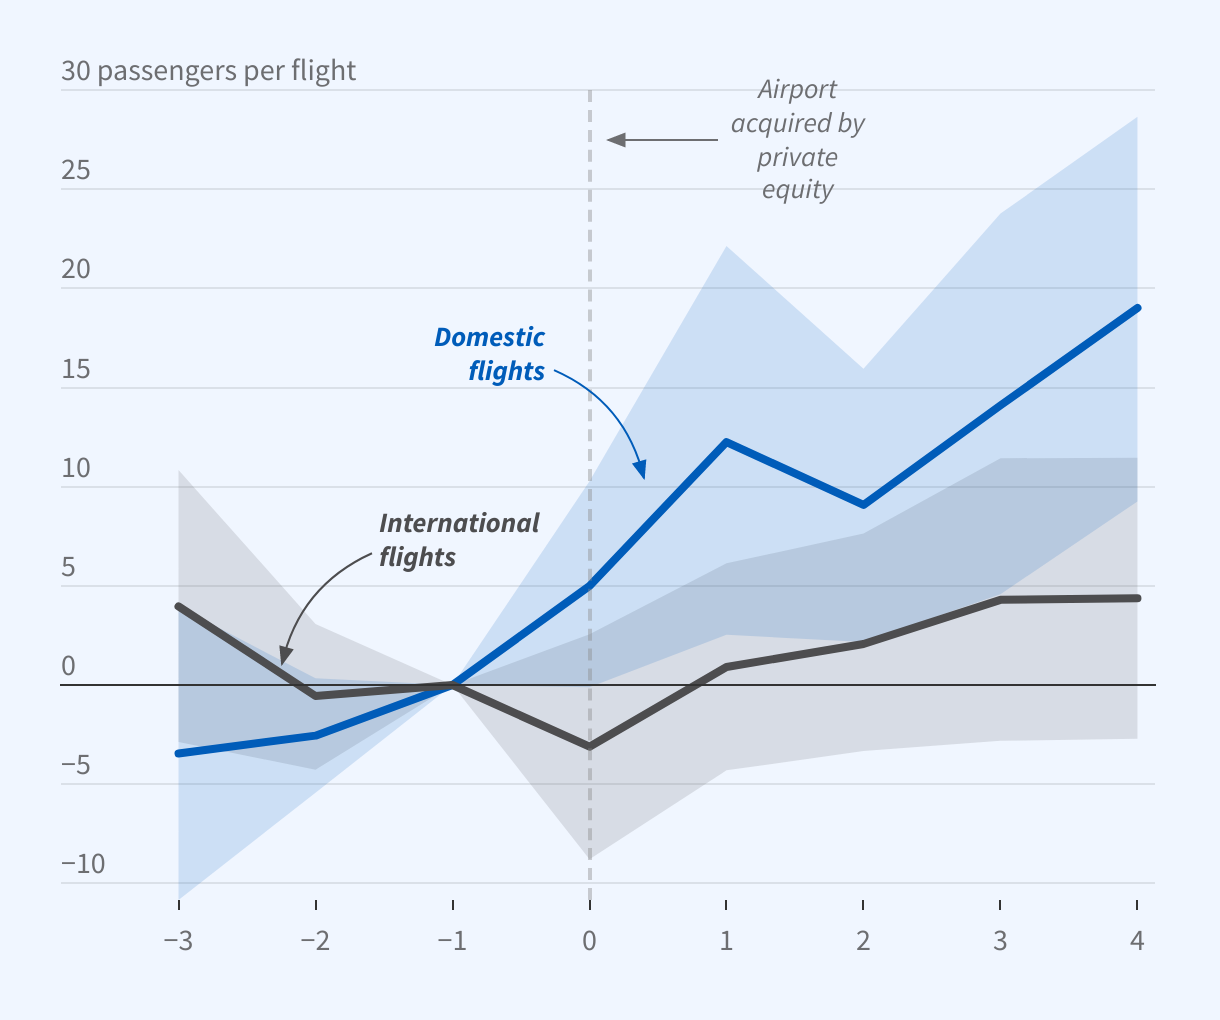
The graph is an event-study chart titled, “Private Equity Acquisition of Airports and Passenger Volume.”
The chart plots estimates of the difference in the number of passengers per flight between private-equity (PE)- and government-owned airports, relative to the year before acquisition, for both international and domestic flights.
The y-axis ranges from -10 to 30 passengers per flight, and the x-axis ranges from 3 years before to 4 years after an airport is acquired by PE.
In the year after acquisition, PE acquisition increases passenger volume by roughly 1 and 12 passengers per flight for international and domestic flights, respectively. These estimates increase to 4 and 19 passengers per flight four years post-acquisition.
Source: Researchers' calculations using data from Preqin, ICAO, and other sources