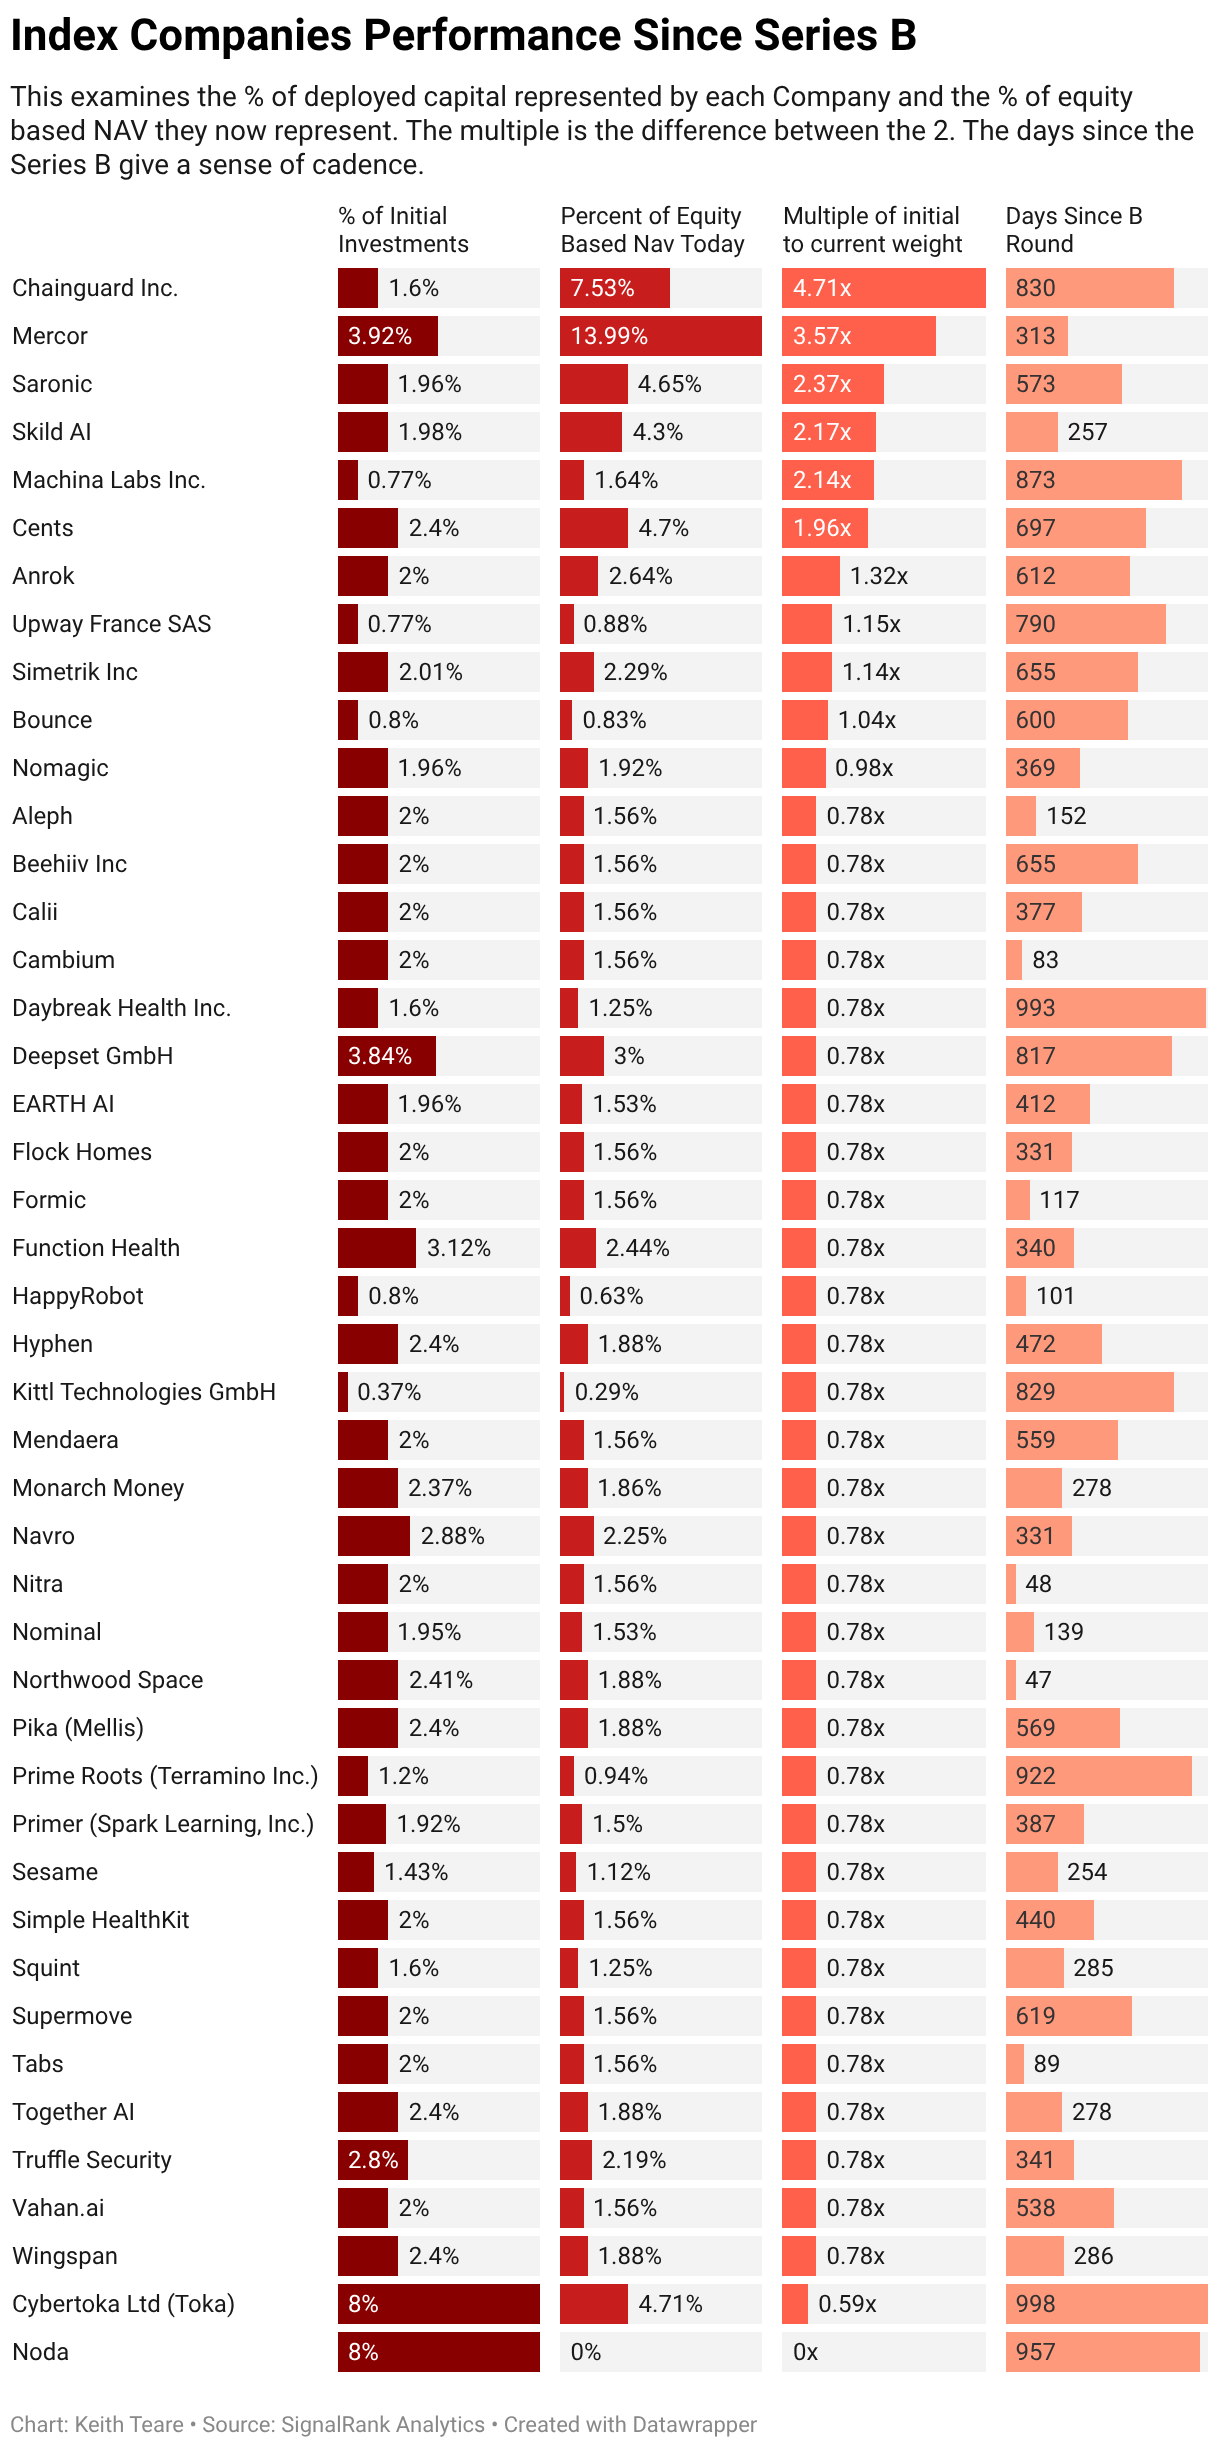
Index Companies Performance Since Series B
This examines the % of deployed capital represented by each Company and the % of equity based NAV they now represent. The multiple is the difference between the 2. The days since the Series B give a sense of cadence.
