Satisfacción al recibir cirugía por identidad/transición de género
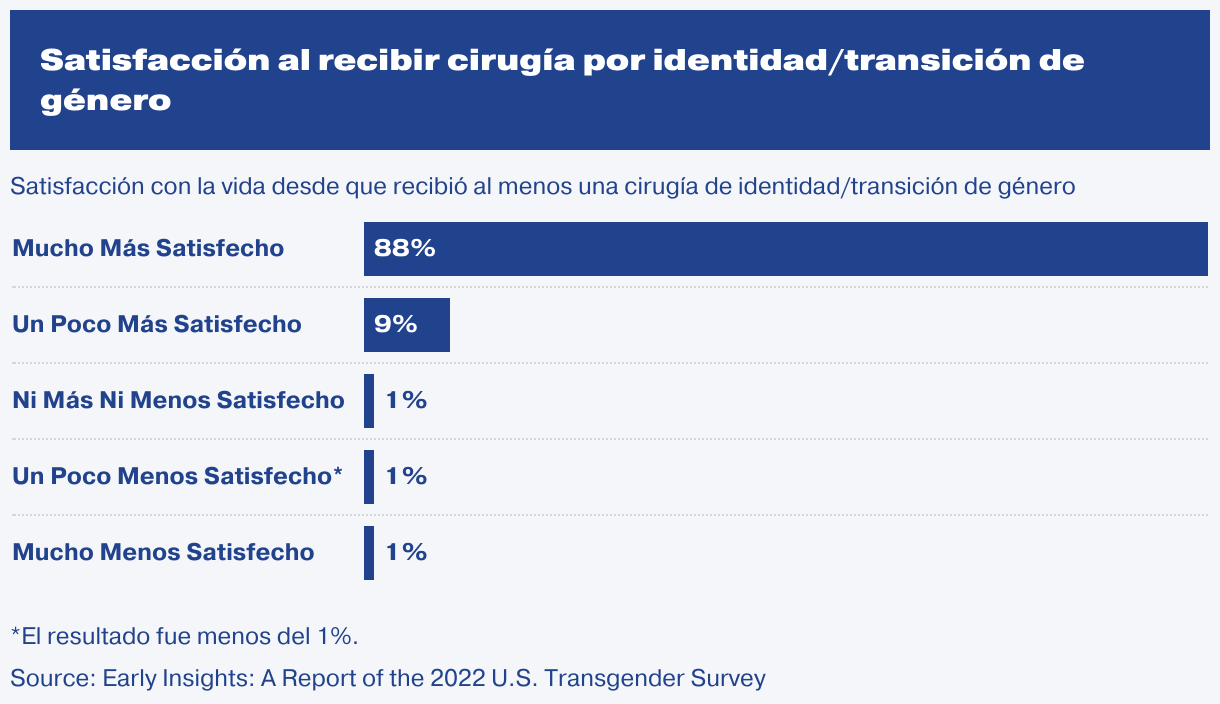
Satisfacción con la vida desde que recibió al menos una cirugía de identidad/transición de género
Bar chart showing the proportions of people who reported their satisfaction with life following surgery or surgeries for gender identity or transition, among those who had at least one: 88% were a lot more satisfied, 9% were a little more satisfied, 2% were neither more nor less satisfied, 1% were a little less satisfied, and 1% were a lot less satisfied with their lives after surgery.
