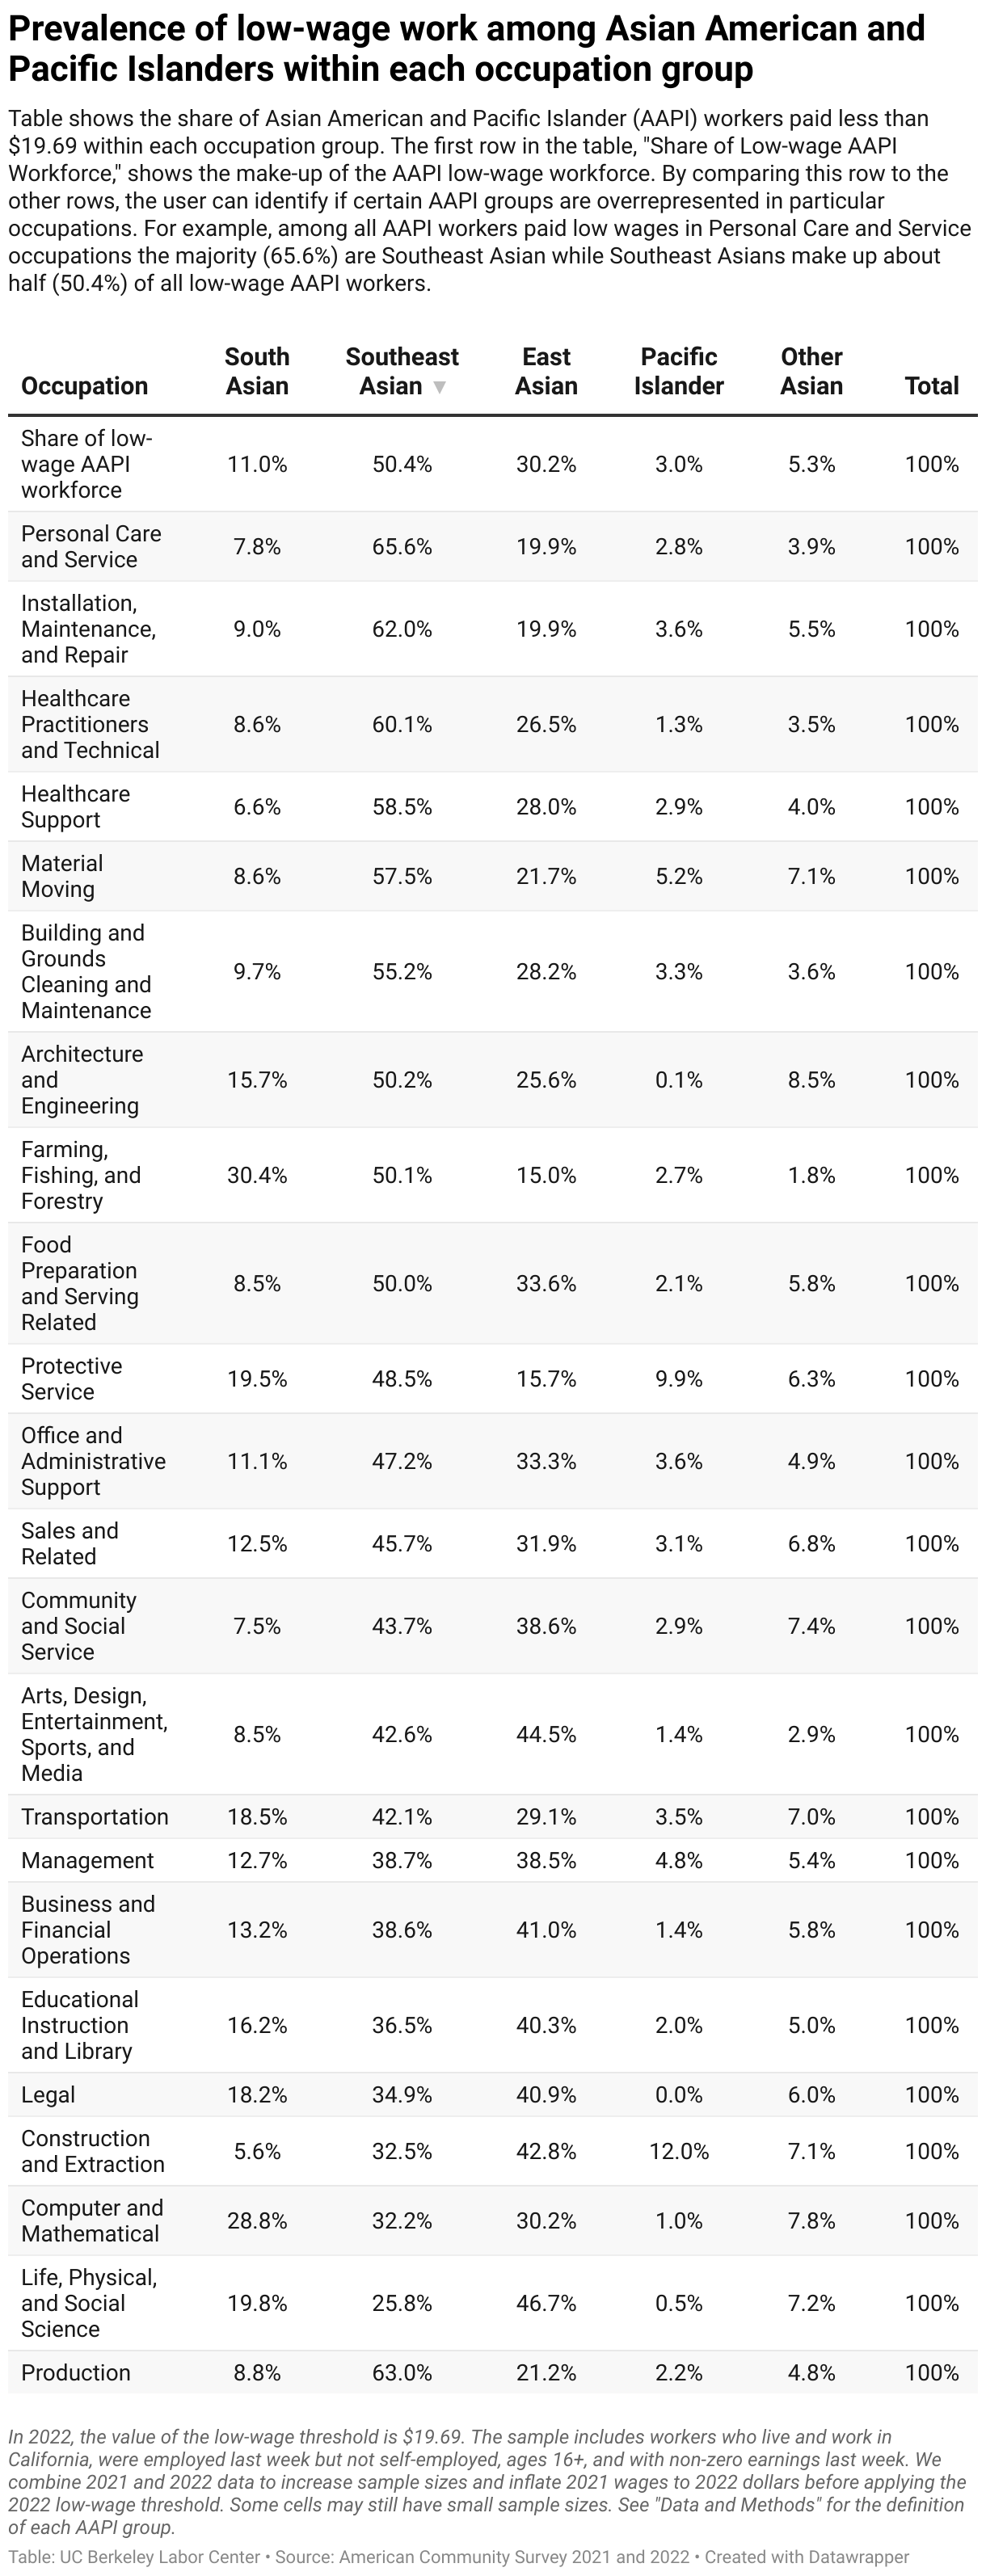
Prevalence of low-wage work among Asian American and Pacific Islanders within each occupation group
Table shows the share of Asian American and Pacific Islander (AAPI) workers paid less than $19.69 within each occupation group. The first row in the table, "Share of Low-wage AAPI Workforce," shows the make-up of the AAPI low-wage workforce. By comparing this row to the other rows, the user can identify if certain AAPI groups are overrepresented in particular occupations. For example, among all AAPI workers paid low wages in Personal Care and Service occupations the majority (65.6%) are Southeast Asian while Southeast Asians make up about half (50.4%) of all low-wage AAPI workers.
