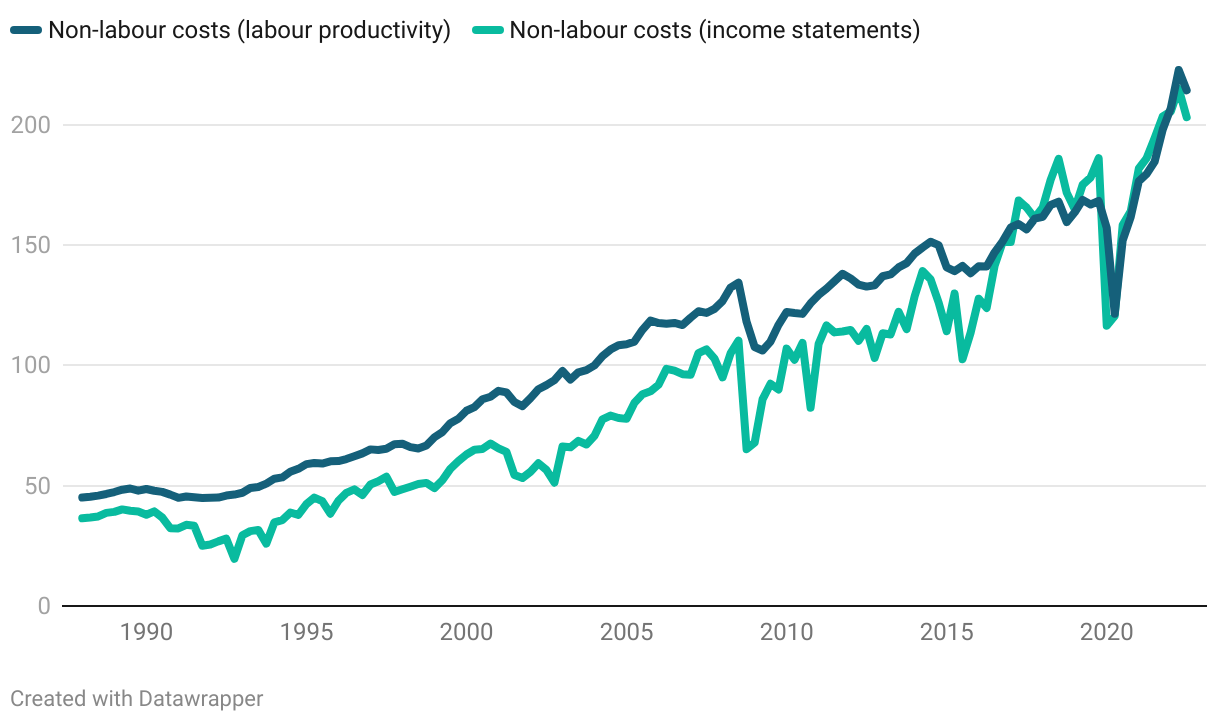
Figure 7: Reconciliation of labour productivity and income statement datasets
$ billions
Figure 7: Line chart comparing non-labour costs calculated using labour productivity and income statements since 1988. The correlation between the series is high, with an R-squared of 0.94 and the match up in nominal values has been particularly close since 2017.