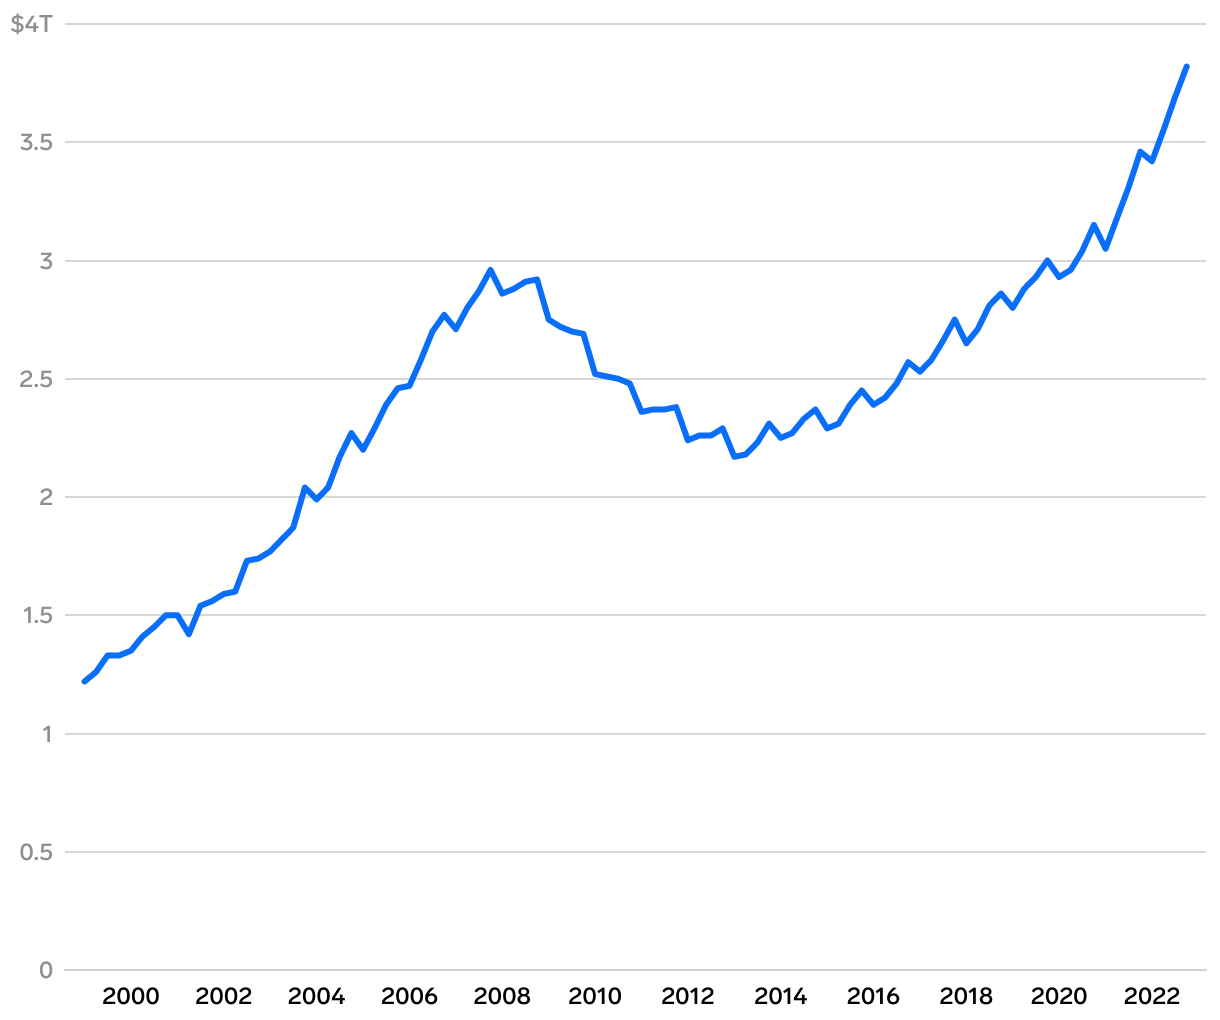
How debt for millennials compares to previous generations at 30 to 39 years old
Line chart showing total debt of those ages 30 to 39 each quarter, starting in the first quarter of 1999.
(Please use a modern browser to see the interactive version of this visualization)