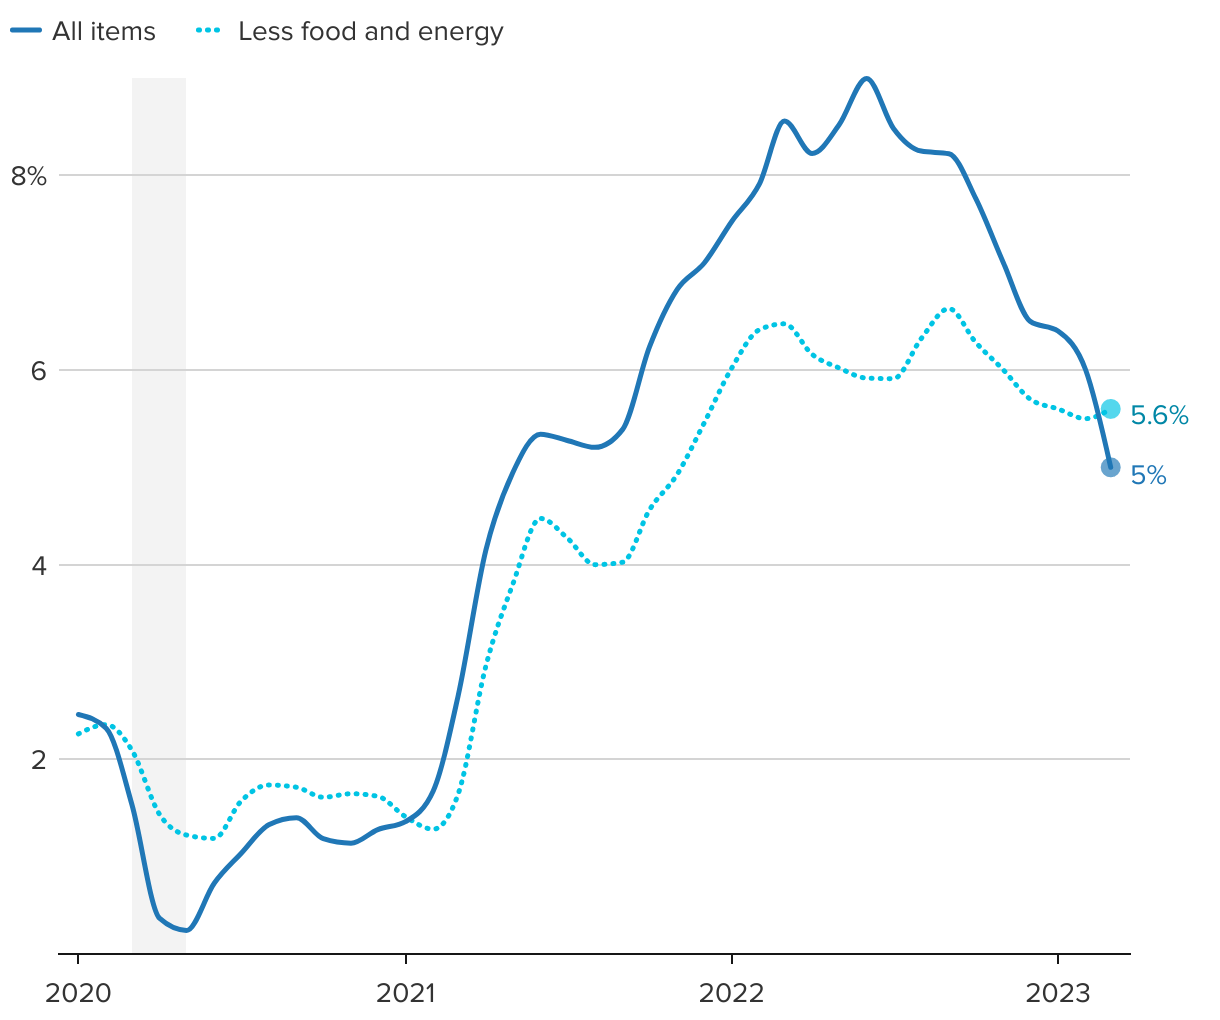
U.S. consumer price index
Year-over-year percent change through March 2023
The line chart shows the year-over-year change in the consumer price index for all items and all items less food and energy from January 2020 through March 2023.
Year-over-year percent change through March 2023