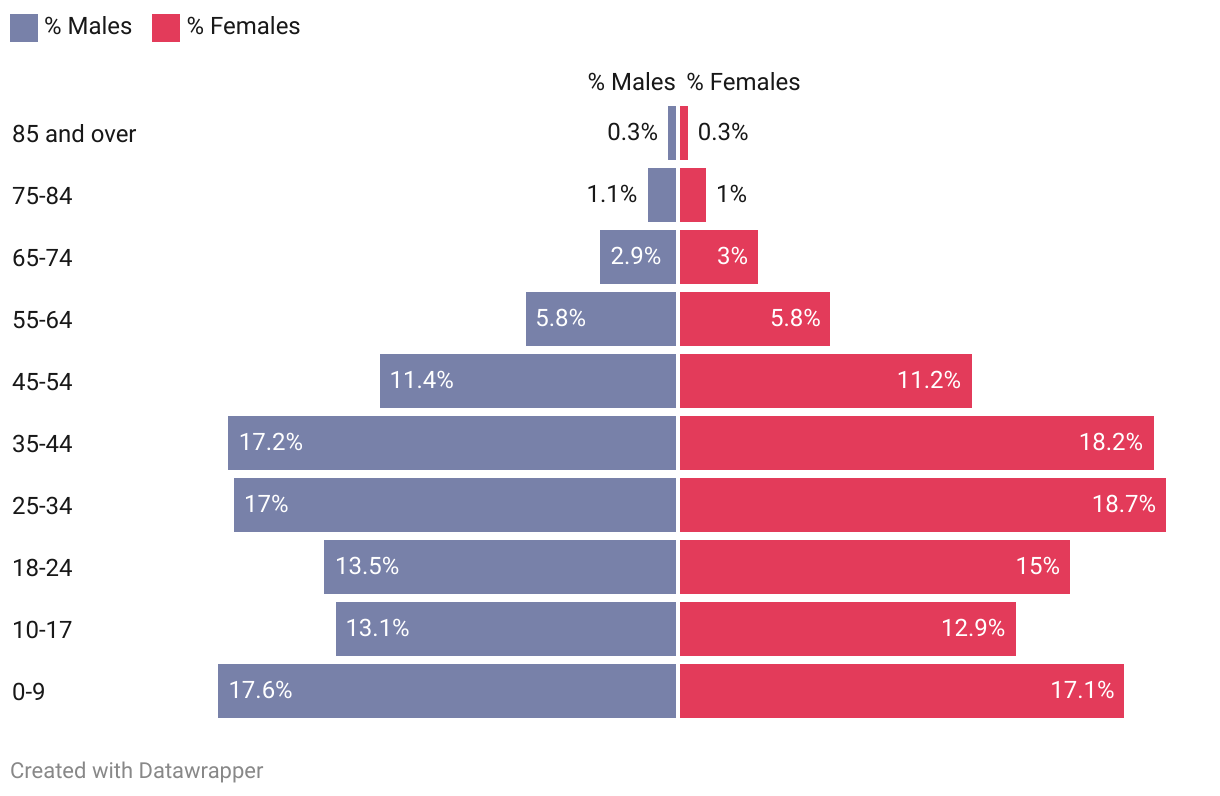
Scotland's BME population, by age and sex
A pyramid chart titled "Scotland's BME population, by age and sex." It displays the percentage of Scotland's Black/minority ethnic population belonging to each sex category and age range, listed from '0-9' to '85 and over'.
The chart shows that:
There are slightly more BME women than there are men.
The BME population is clustered around the '0-9' age range, as well as 'the 25-34' and '35-44' ranges.