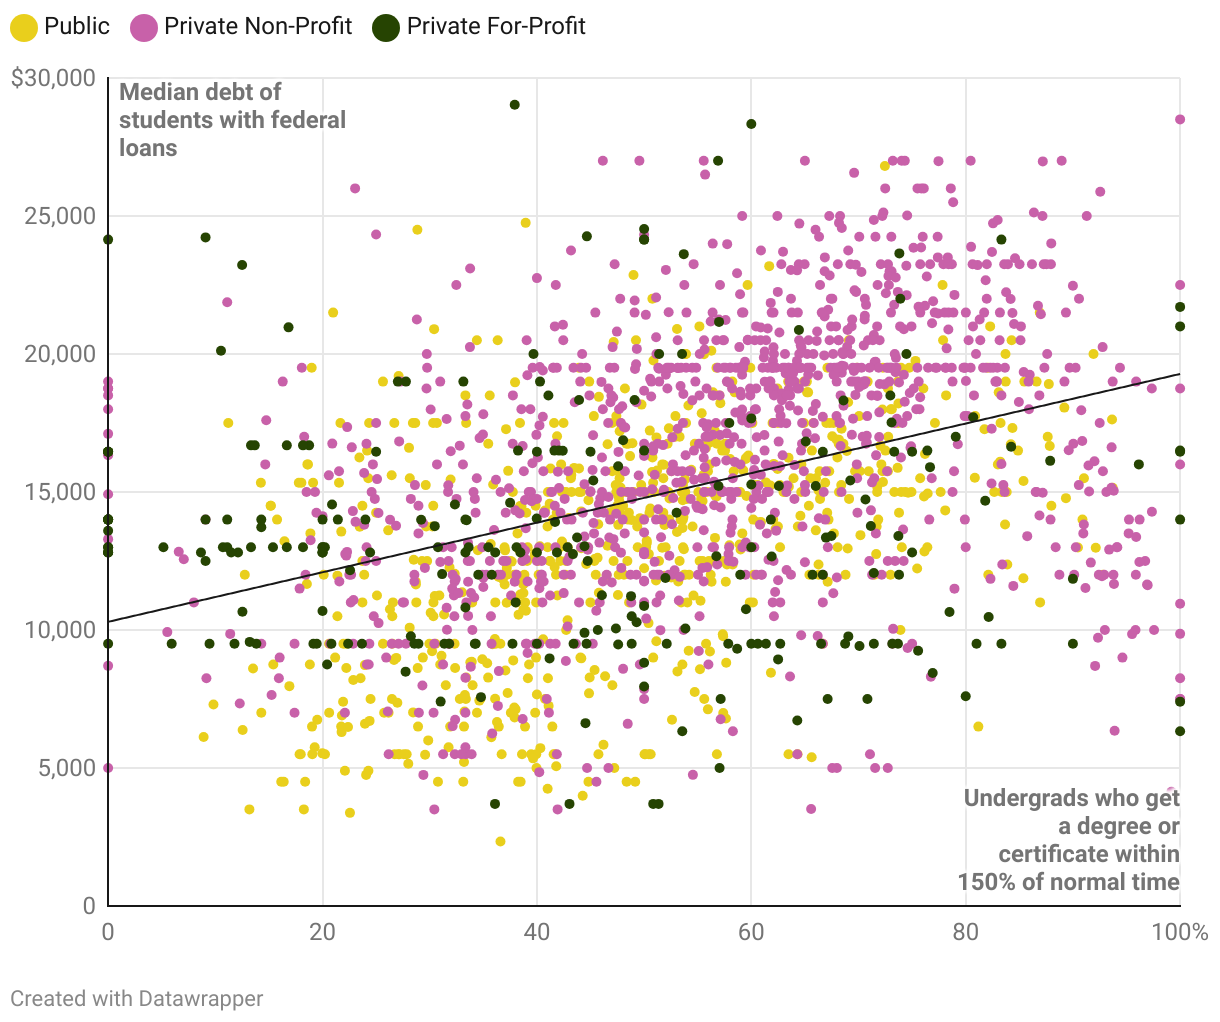
A scatter plot chart showing a correlation between schools’ median debt values and the share of undergrads who get a degree within 150% of normal time. (150% of normal time for a 2-year program is 3 years and for a 4-year program is 6 years.) The lower the rate of completion, the lower the median debt. The higher the rate of completion, the higher the debt. Each dot in the scatter plot is a different school in the College Scorecard database.