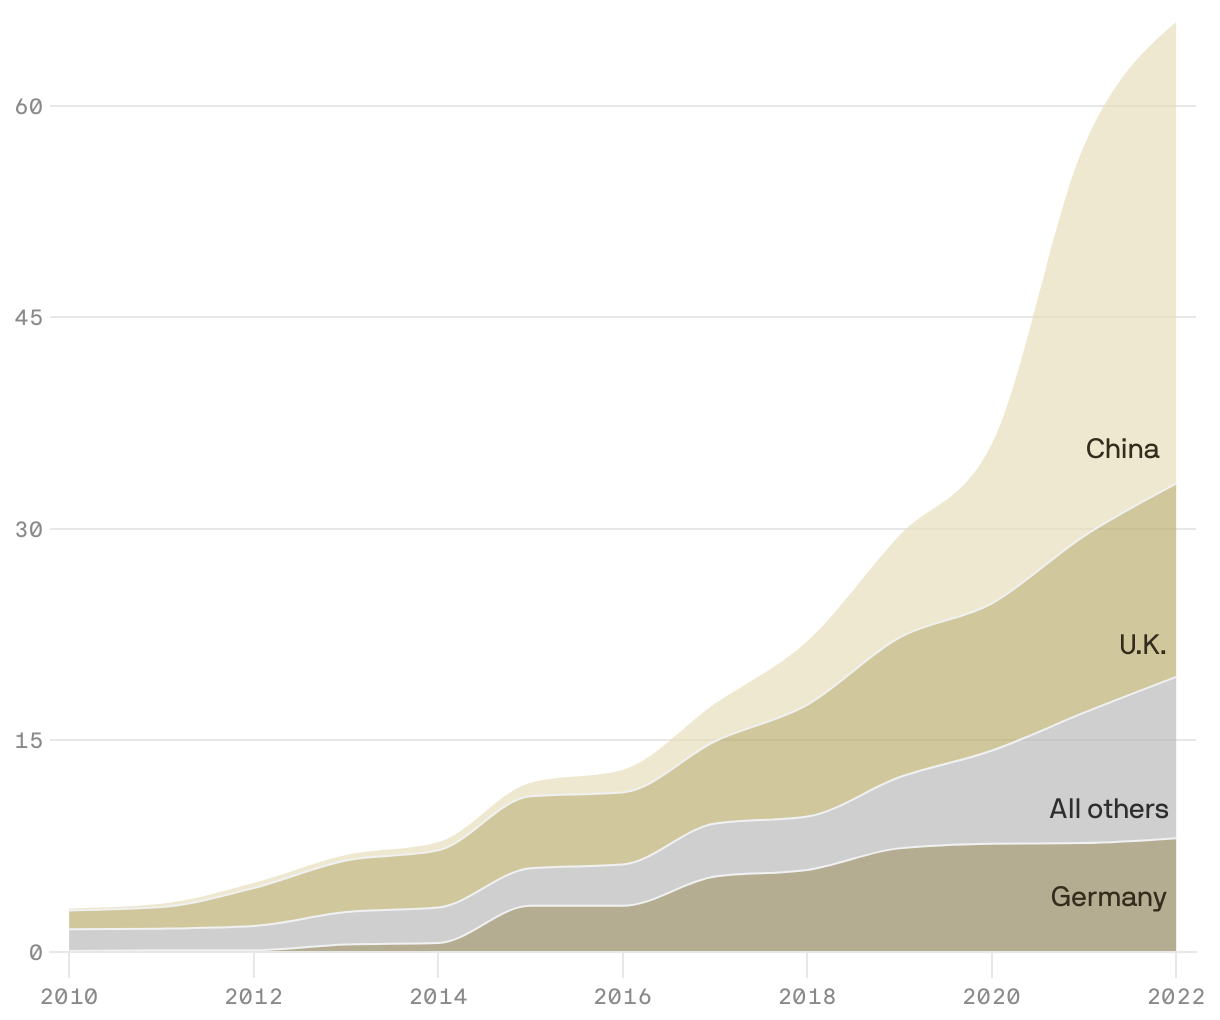
Cumulative installed offshore wind capacity
In gigawatts; Annually; 2010-2022
Tan area chart showing the cumulative offshore wind capacity for the U.K., Germany, China and the rest of the world in gigawatts from 2010 to 2022. In 2010, the cumulative was less than 10 GW. This steadily grew, with China leading. By 2022, China had 33 GW, Germany had 8 GW, the U.K. had 13, and all other countries had cumulative 11 GW.