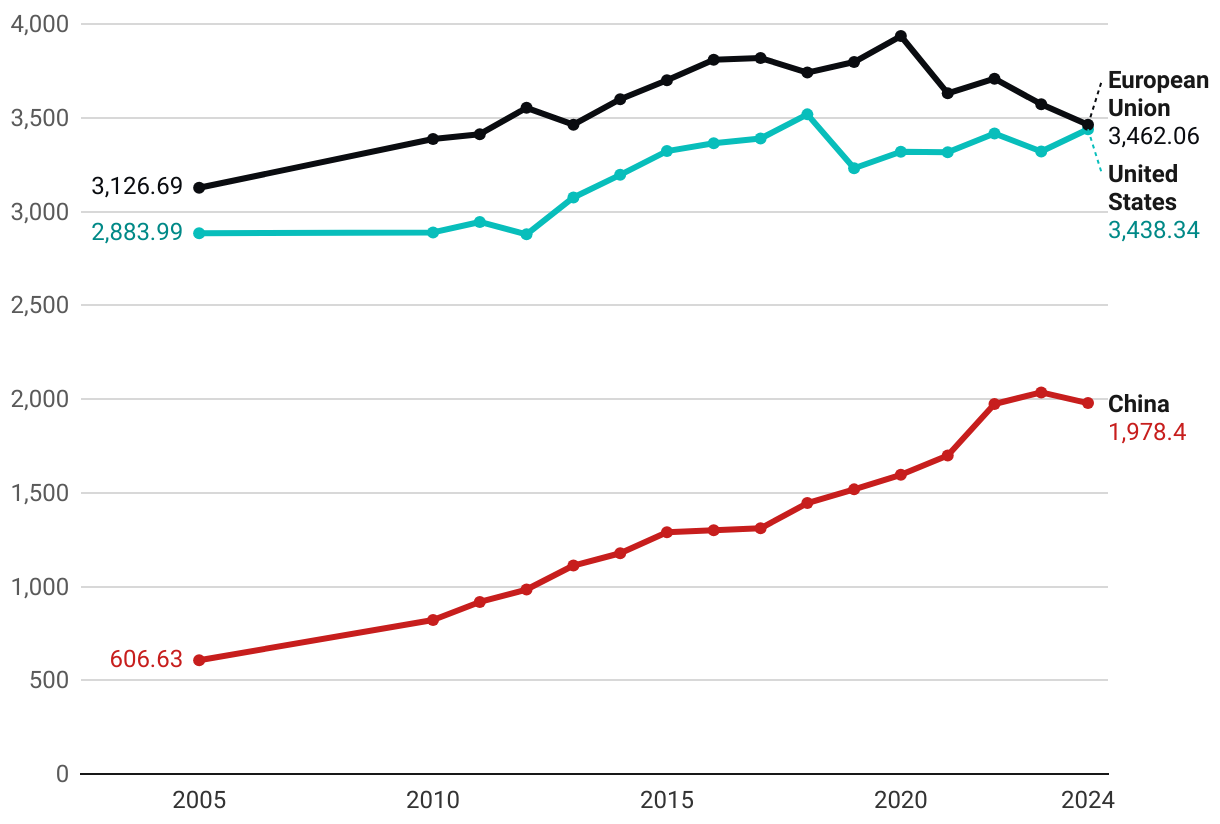
Line graph of the evolution of the global presence of the US, EU and China between 2005 and 2024. The EU's loss of presence seems to point to a reduction in its role as a global actor, but if we compare its evolution with that of the US and China, three trends stand out: 1) the EU (dark blue line) continues to hold the highest level of global presence in the entire dataset, despite a significant decline from 2020 onwards, 2) the US (cyan line) continues to hold the highest level of global presence in the entire dataset, despite a significant decline from 2020 onwards, and 3) China (violet line) stalls its growth, which had been strengthened with the pandemic, recording, for the first time in the series, a drop in global presence in absolute terms.