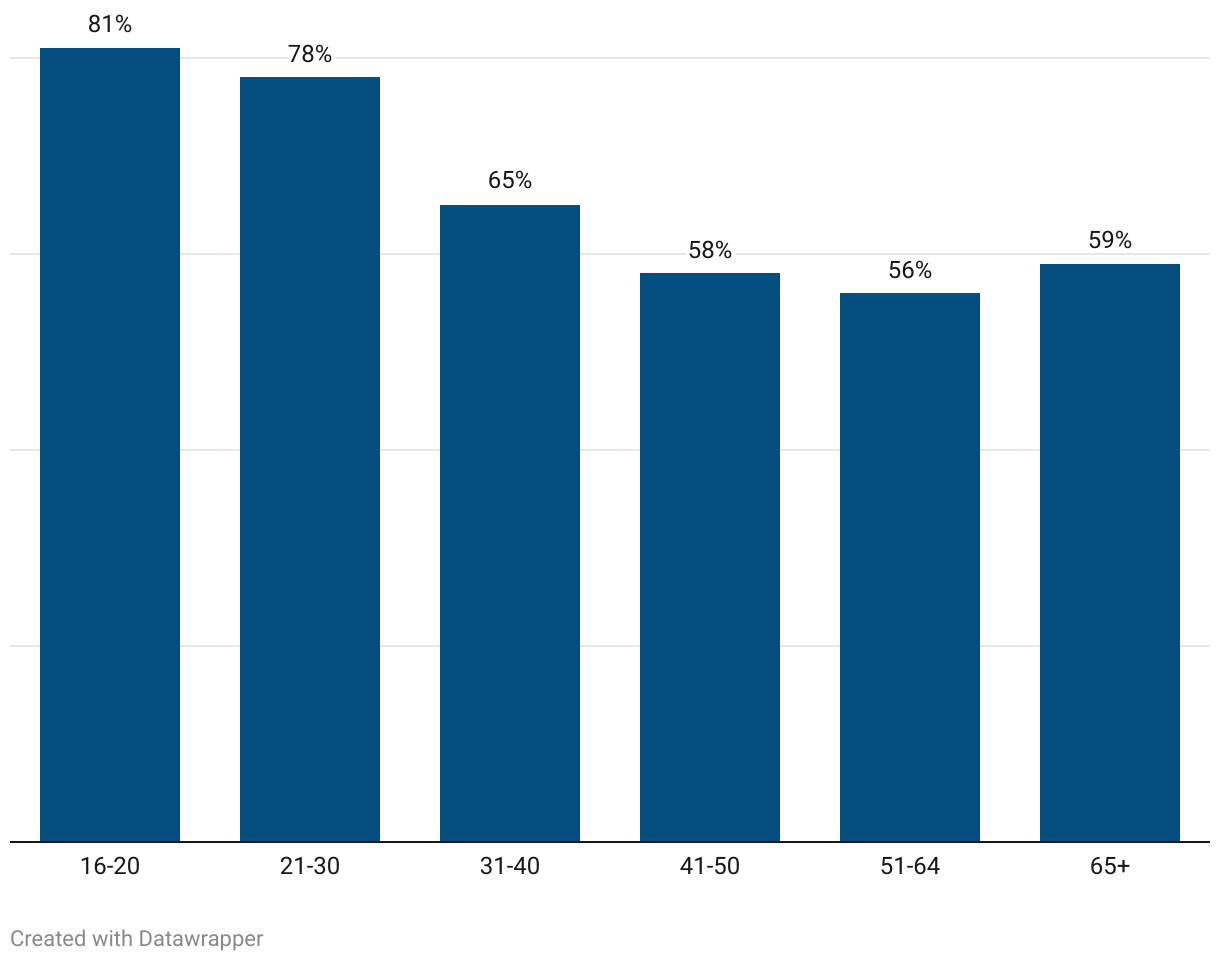
Drivers Preferring to Drive Less or Not at All
The chart contains six columns to show total annual tonnage amounts for the Ports of Cincinnati and Northern Kentucky since its designation, 2015 to 2020.
(Please use a modern browser to see the interactive version of this visualization)