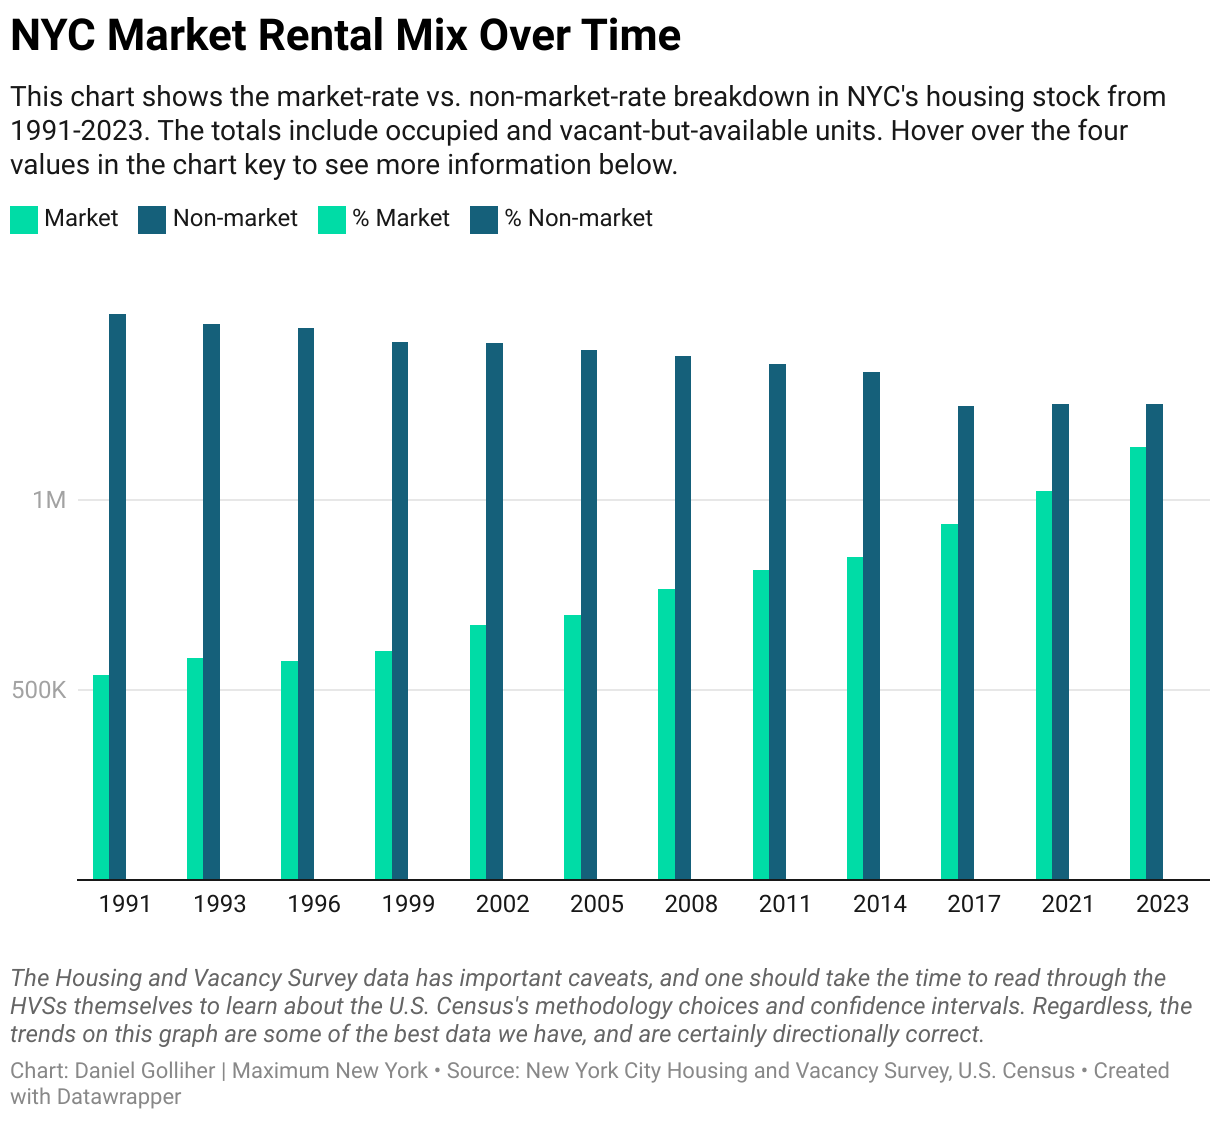
NYC Market Rental Mix Over Time
This chart shows the market-rate vs. non-market-rate breakdown in NYC's housing stock from 1991-2023. The totals include occupied and vacant-but-available units. Hover over the four values in the chart key to see more information below.
