The Olympics are heating up
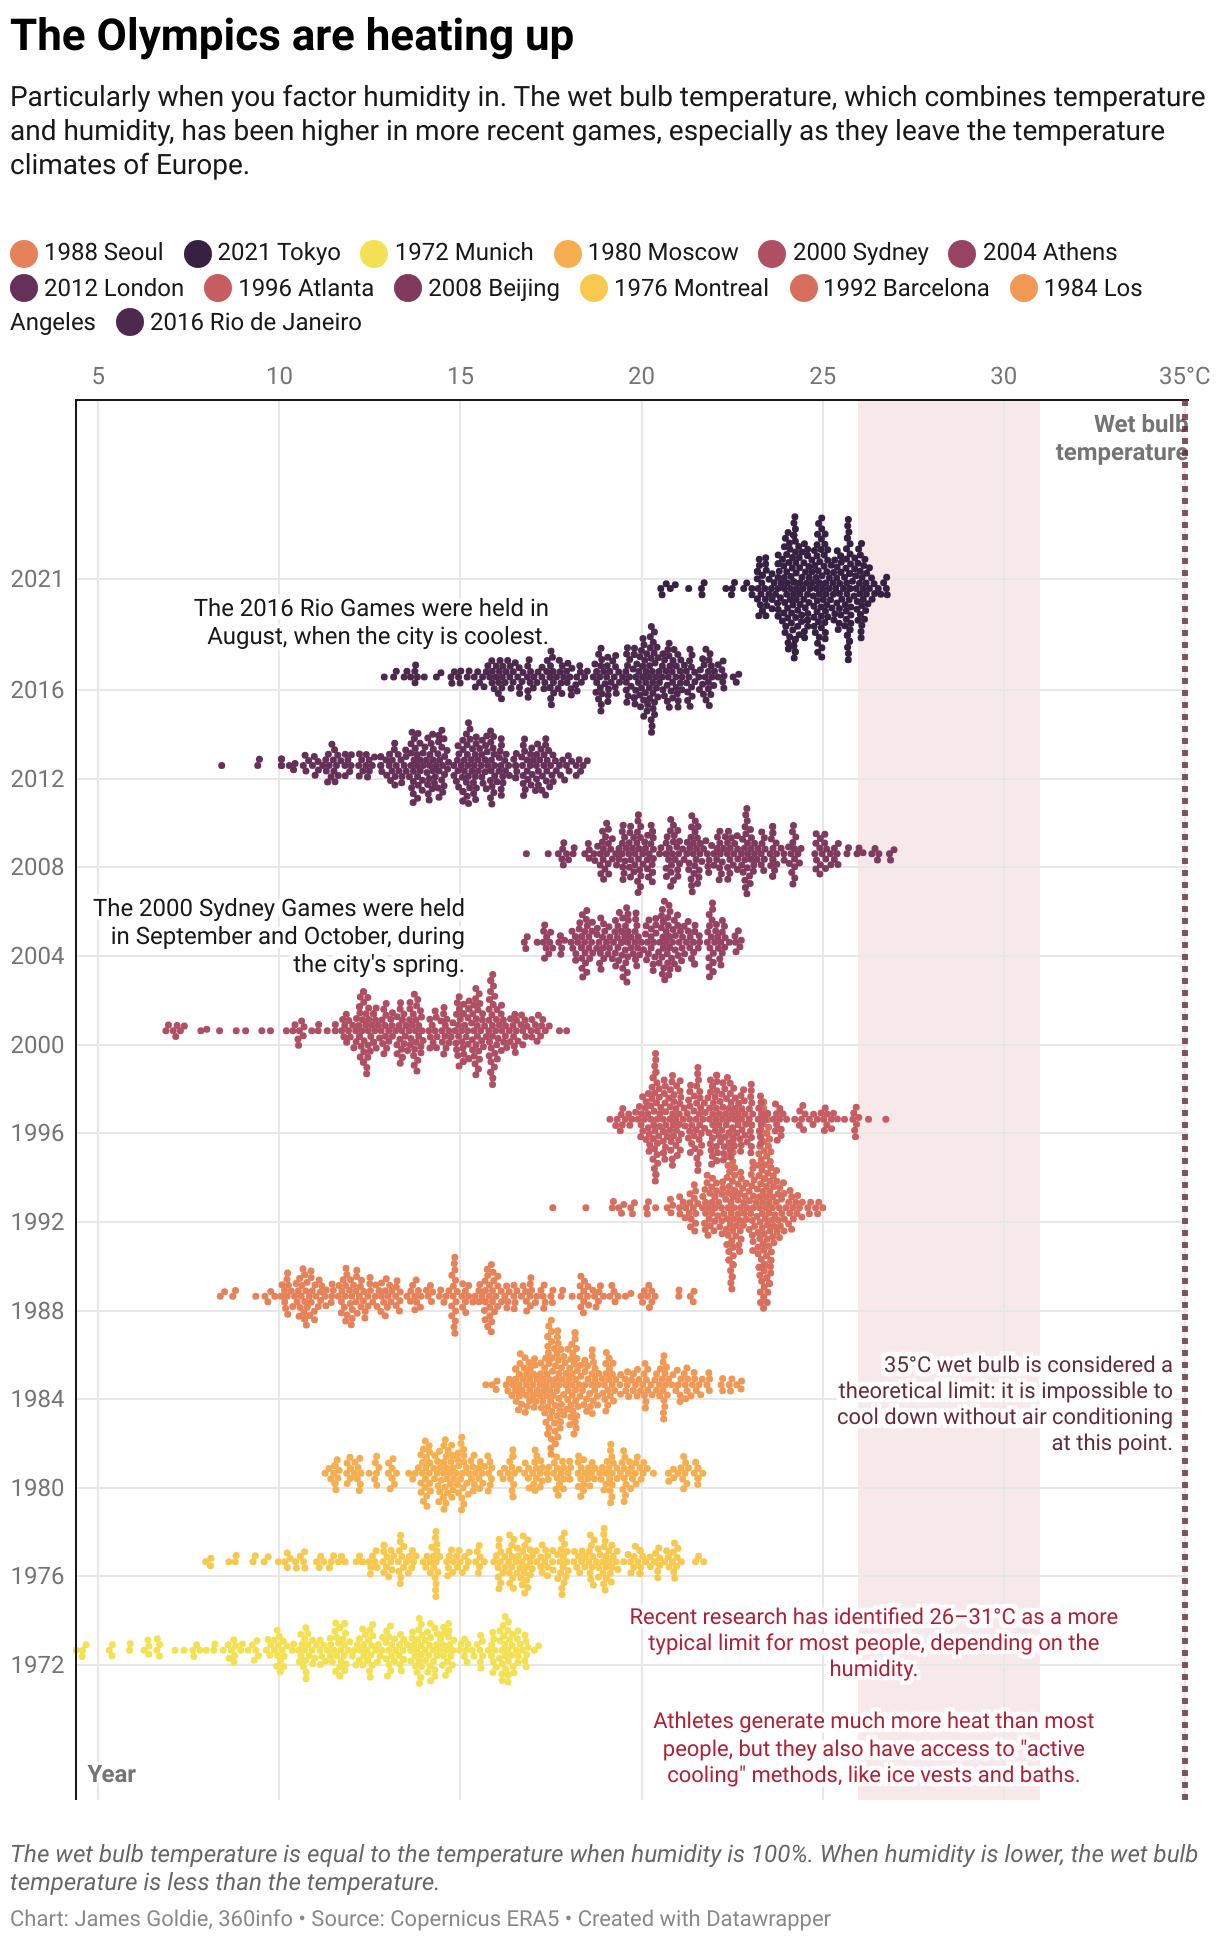
Particularly when you factor humidity in. The wet bulb temperature, which combines temperature and humidity, has been higher in more recent games, especially as they leave the temperature climates of Europe.
A beeswarm chart — that is, a chart where points cluster on one axis. Here, the vertical axis is time, showing each Olympic Games from 1972 (Munich) to 2021 (Tokyo). On the horizontal axis is the wet bulb temperature, from cooler on the left to hotter on the right. The chart shows wet bulbs generally getting hotter over time, although there are a few exceptions where Games are either held in a place that is coolest in August (like Sydney or Rio de Janeiro) or a place that is cool all year round, like London.
