U.S. Energy Extraction
Millions of BTUs per day
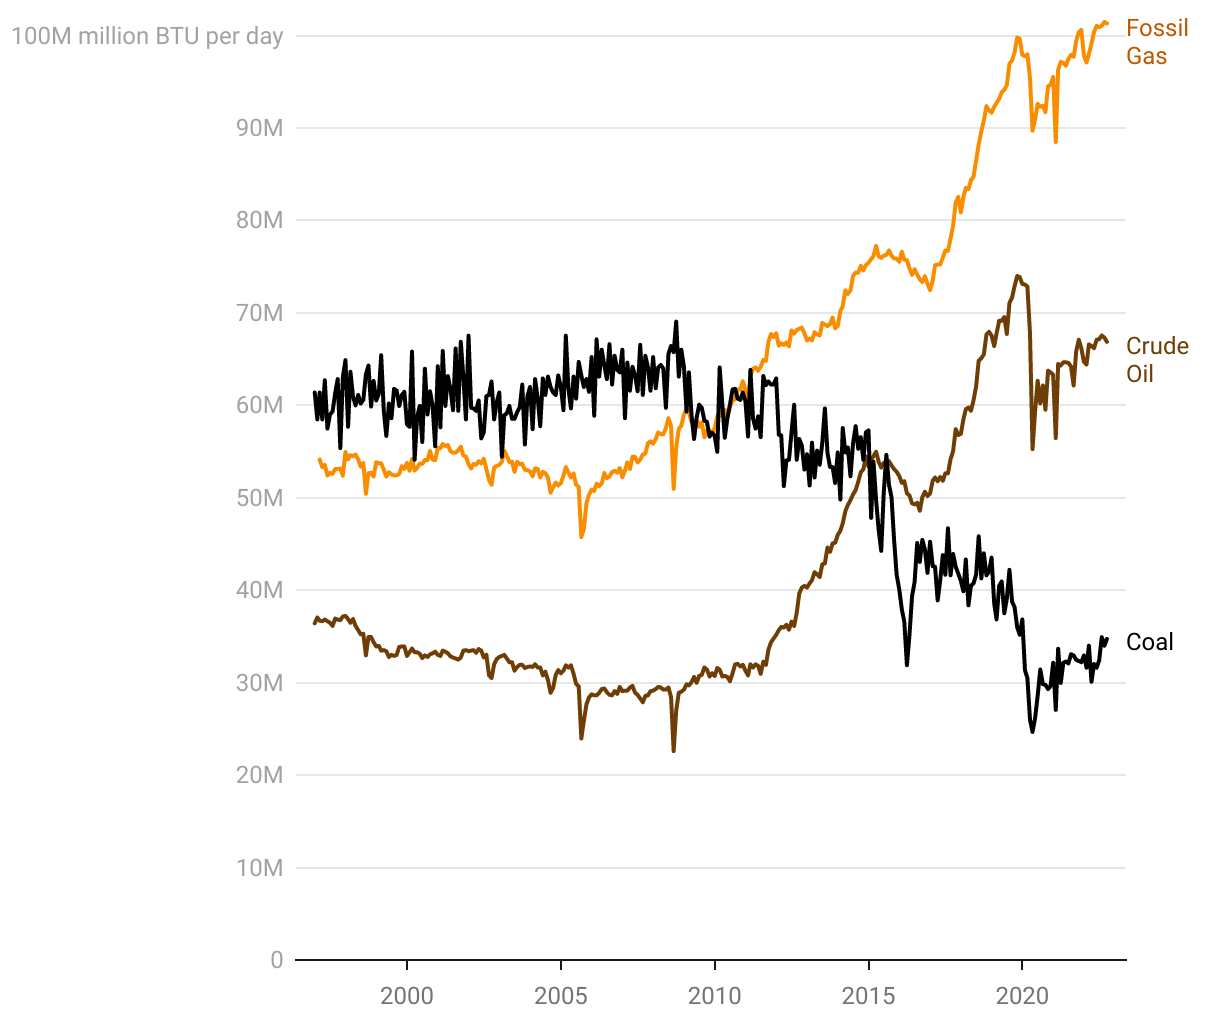
A time series line graph showing the amount of extracted fossil fuels in the USA from 1997 through 2022.
There are three lines: Fossil gas, crude oil, and coal.
The fossil gas line is the largest of the three. It starts out fairly flat from 1997 though 2009 then climbs steadily upward and becomes the largest source of fossil energy extraction from early 2011 to the present.
The crude oil like is roughly parallel to the fossil gas line, but lower. This means that the amount of energy in extracted crude oil is less than that for fossil gas production.
Coal starts out as the highest line on the graph, but beginning in late 2008 coal production has been declining. Coal production has made a slight rebound from 2020 through the present, but it remains a smaller source of energy than oil and gas.