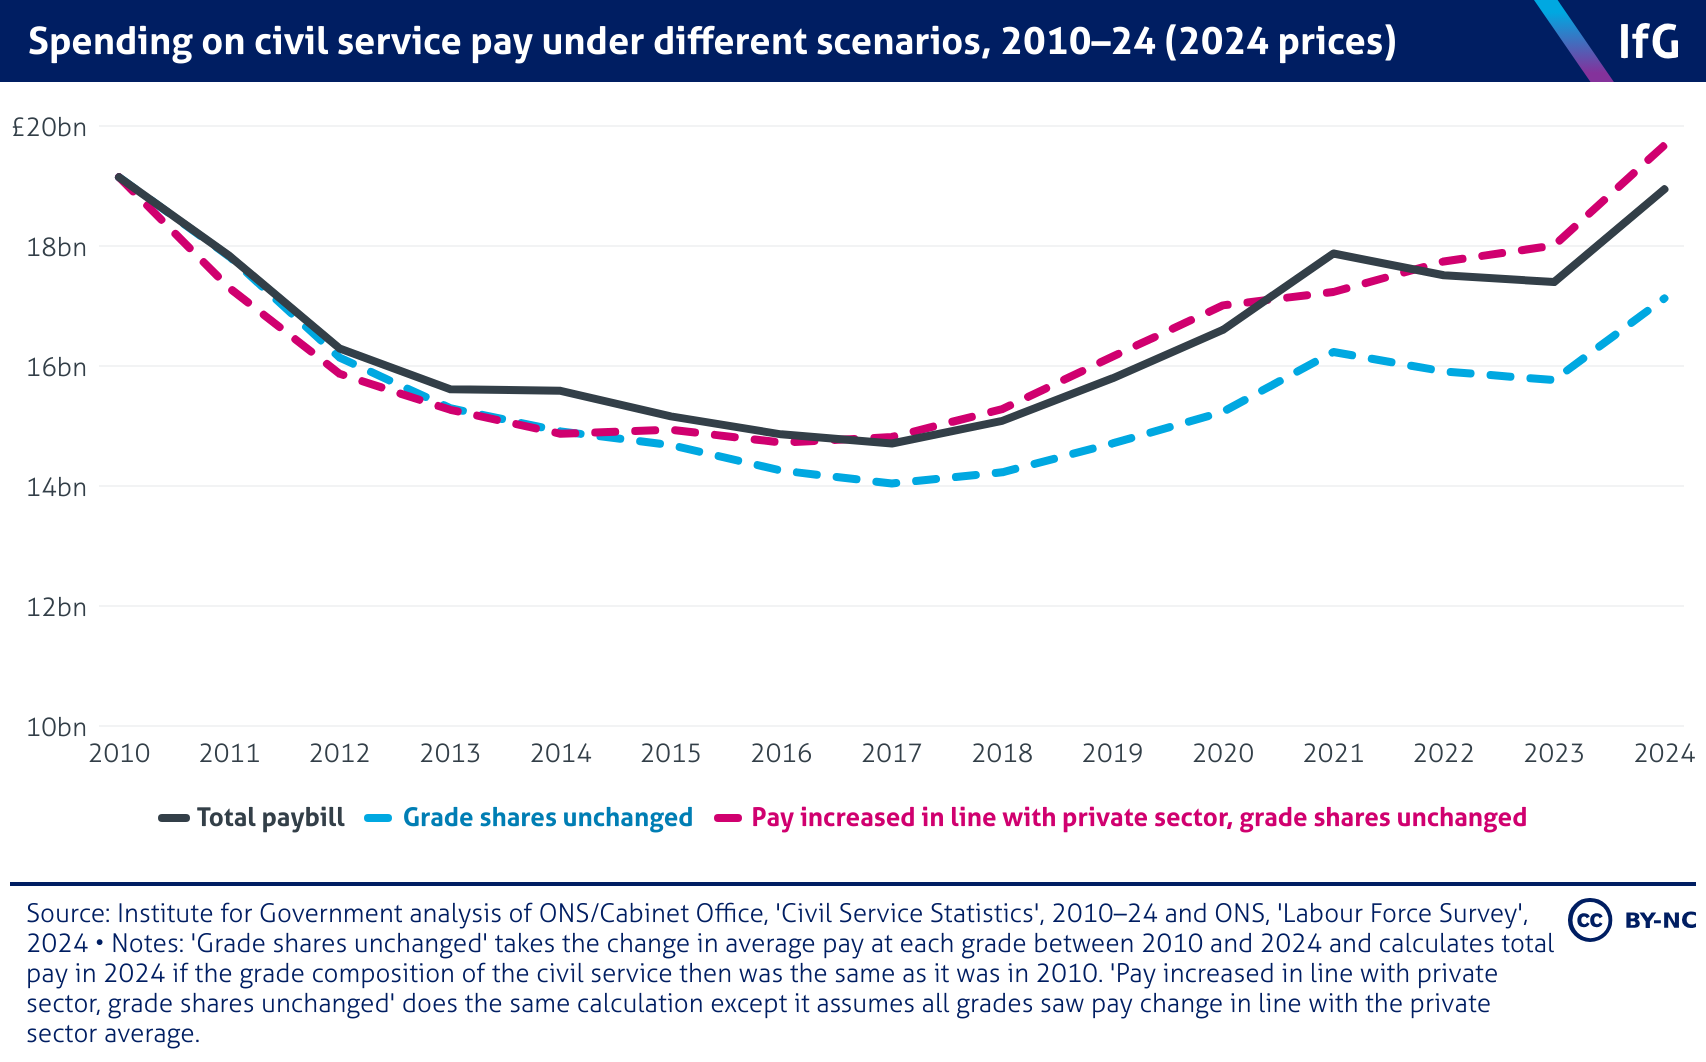
Spending on civil service pay under different scenarios, 2010–24 (2024 prices)

An Institute for Government line chart, showing the total spent on civil service pay between 2010 and 2024. The chart shows how high spending on pay would be in each year under different scenarios, showing that the change in grade structure of the civil service since 2010 is costing more money.