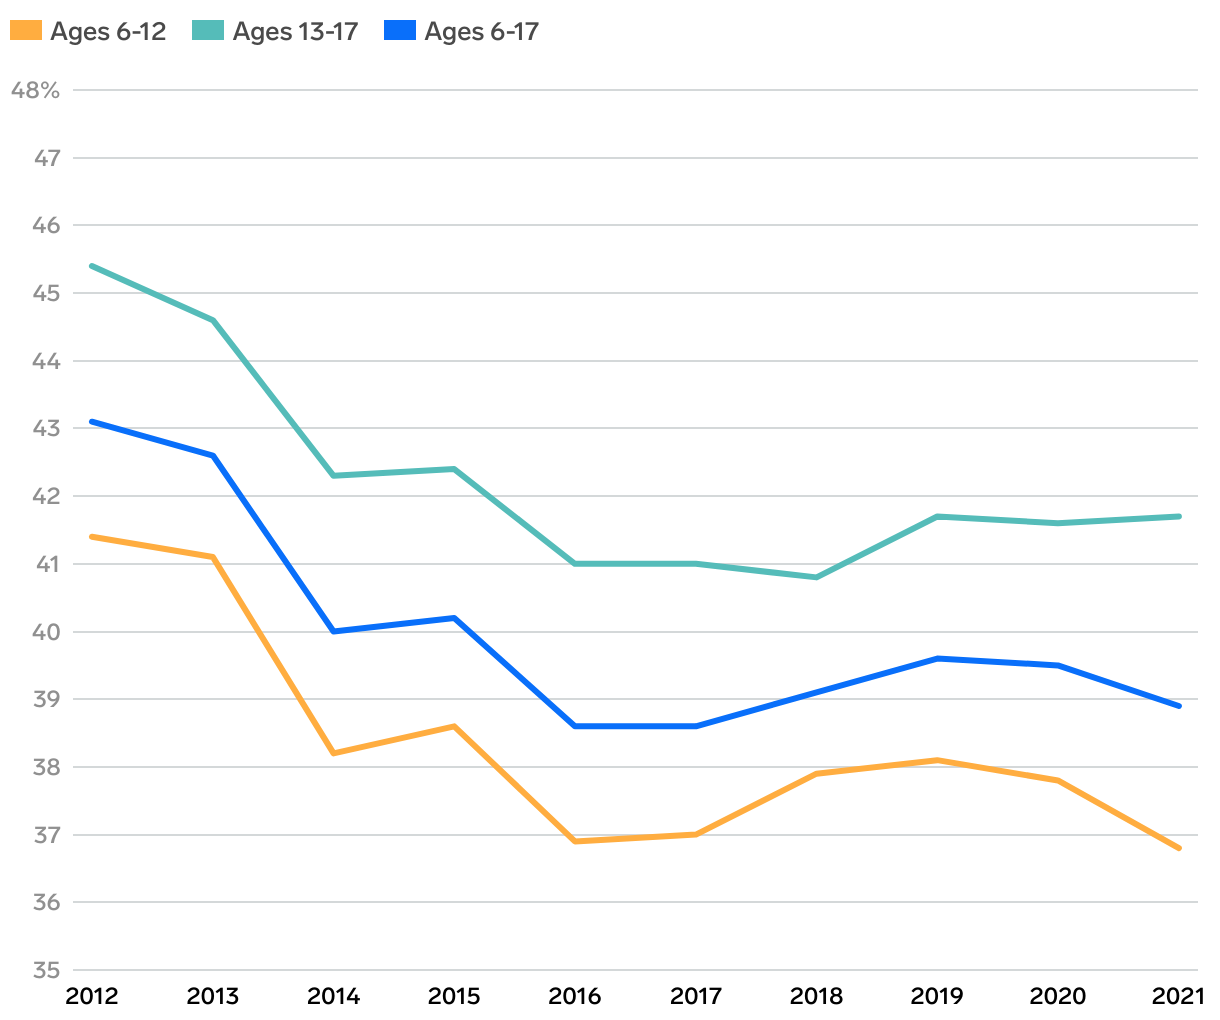
Youth team sports participation rates
Line chart with three lines for different age ranges. These lines show the participation rates for team sports on a regular basis each year from 2012 to 2021
(Please use a modern browser to see the interactive version of this visualization)