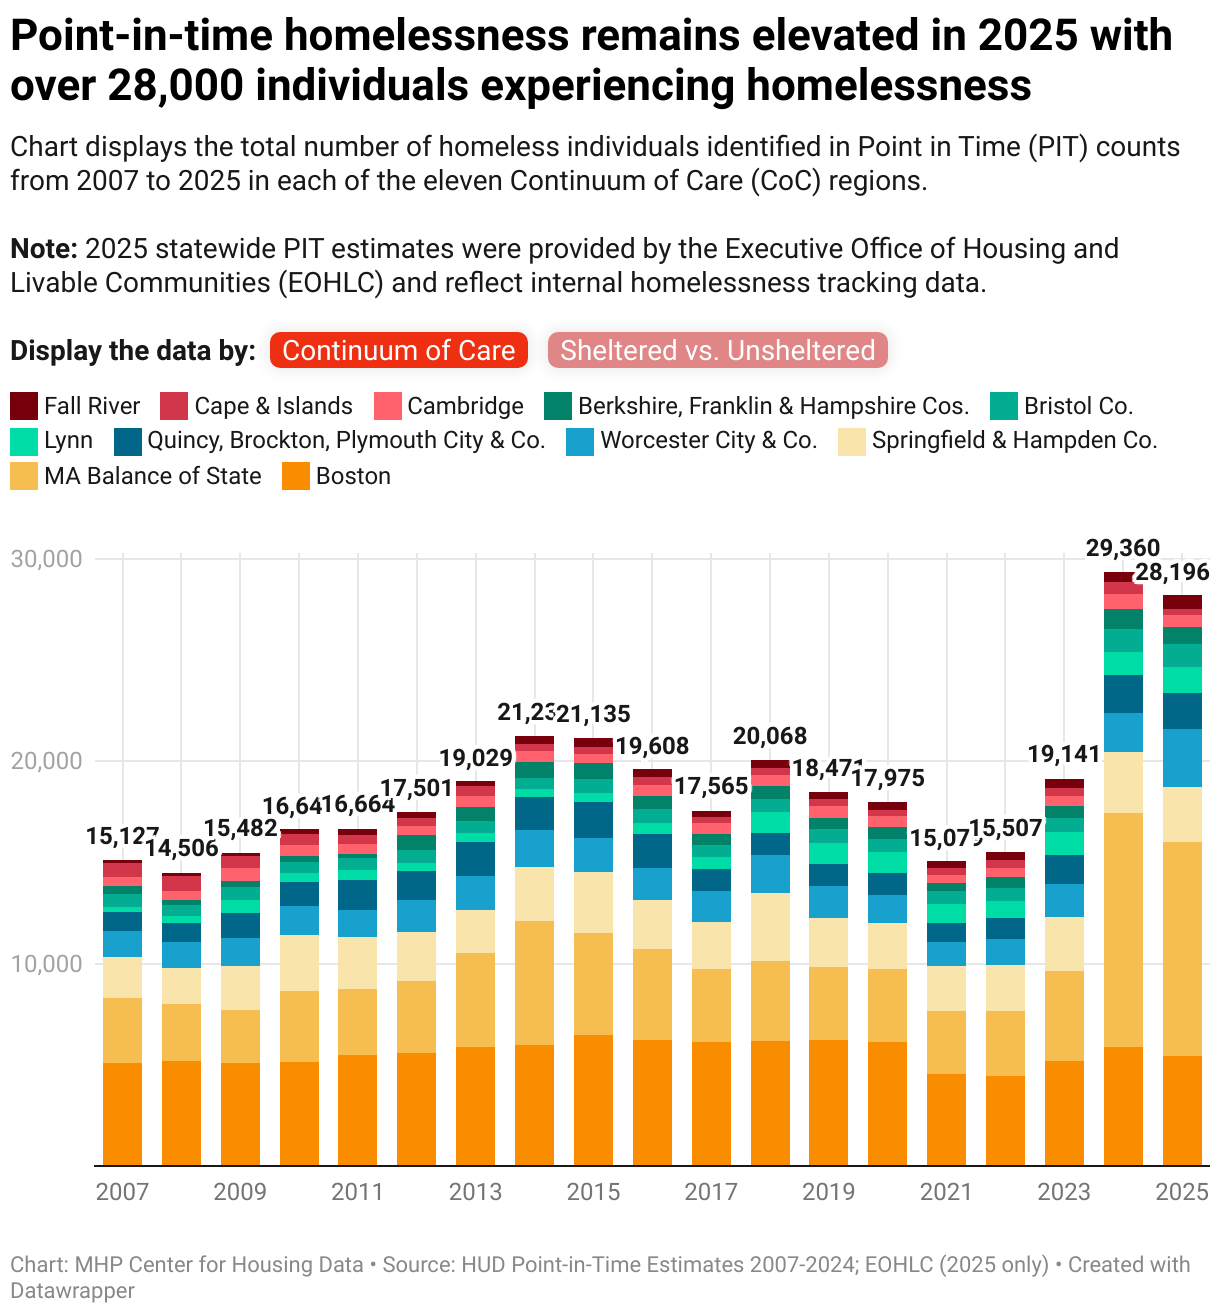
Point-in-time homelessness remains elevated in 2025 with over 28,000 individuals experiencing homelessness
Chart displays the total number of homeless individuals identified in Point in Time (PIT) counts from 2007 to 2025 in each of the eleven Continuum of Care (CoC) regions.
Note: 2025 statewide PIT estimates were provided by the Executive Office of Housing and Livable Communities (EOHLC) and reflect internal homelessness tracking data.
Display the data by:
Continuum of Care
Sheltered vs. Unsheltered
