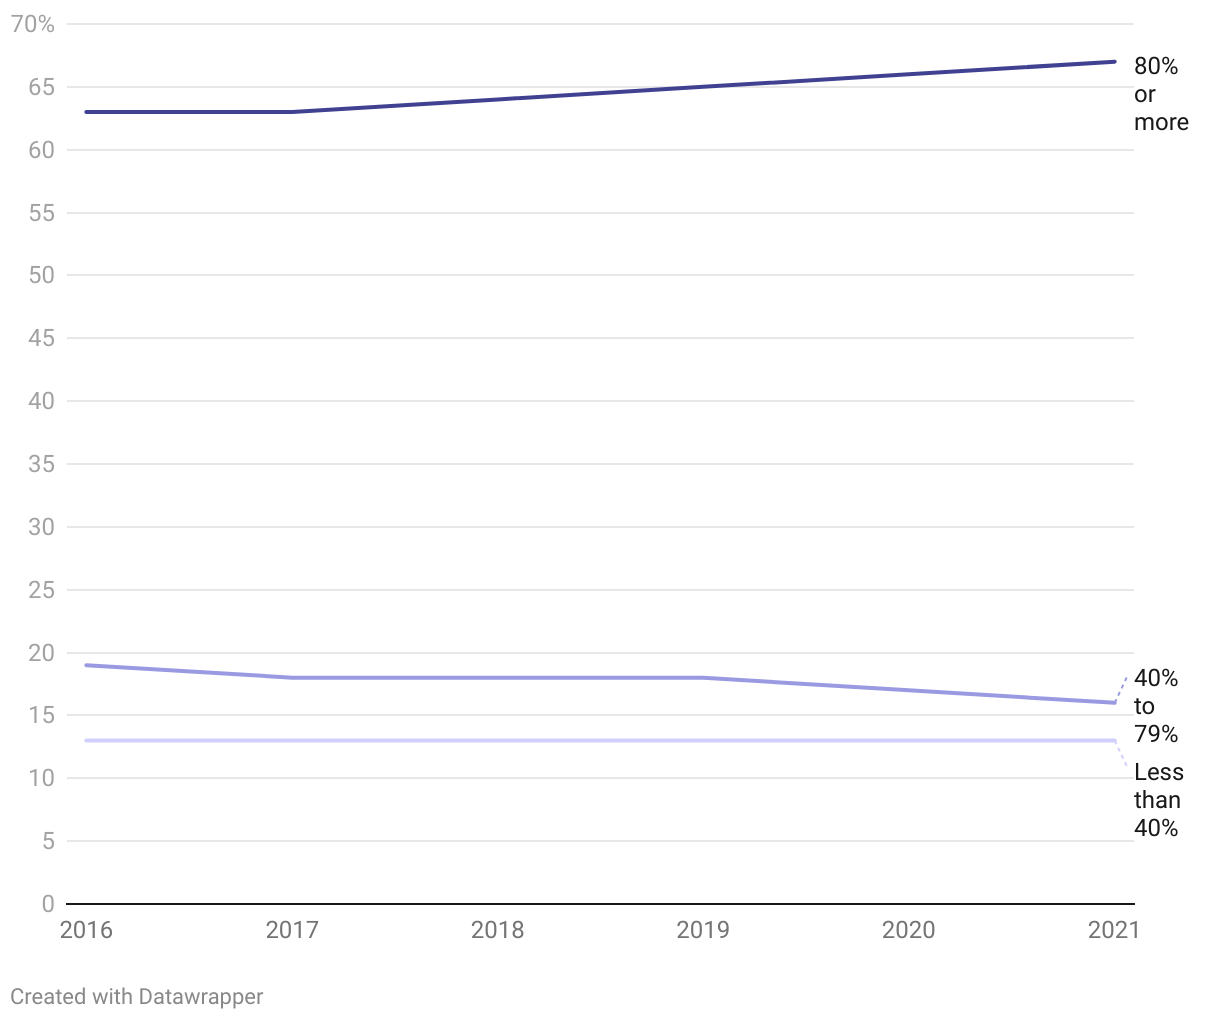
A vertical bar charts shows three different data sets for each of six years from 2016-2021.
(Please use a modern browser to see the interactive version of this visualization)