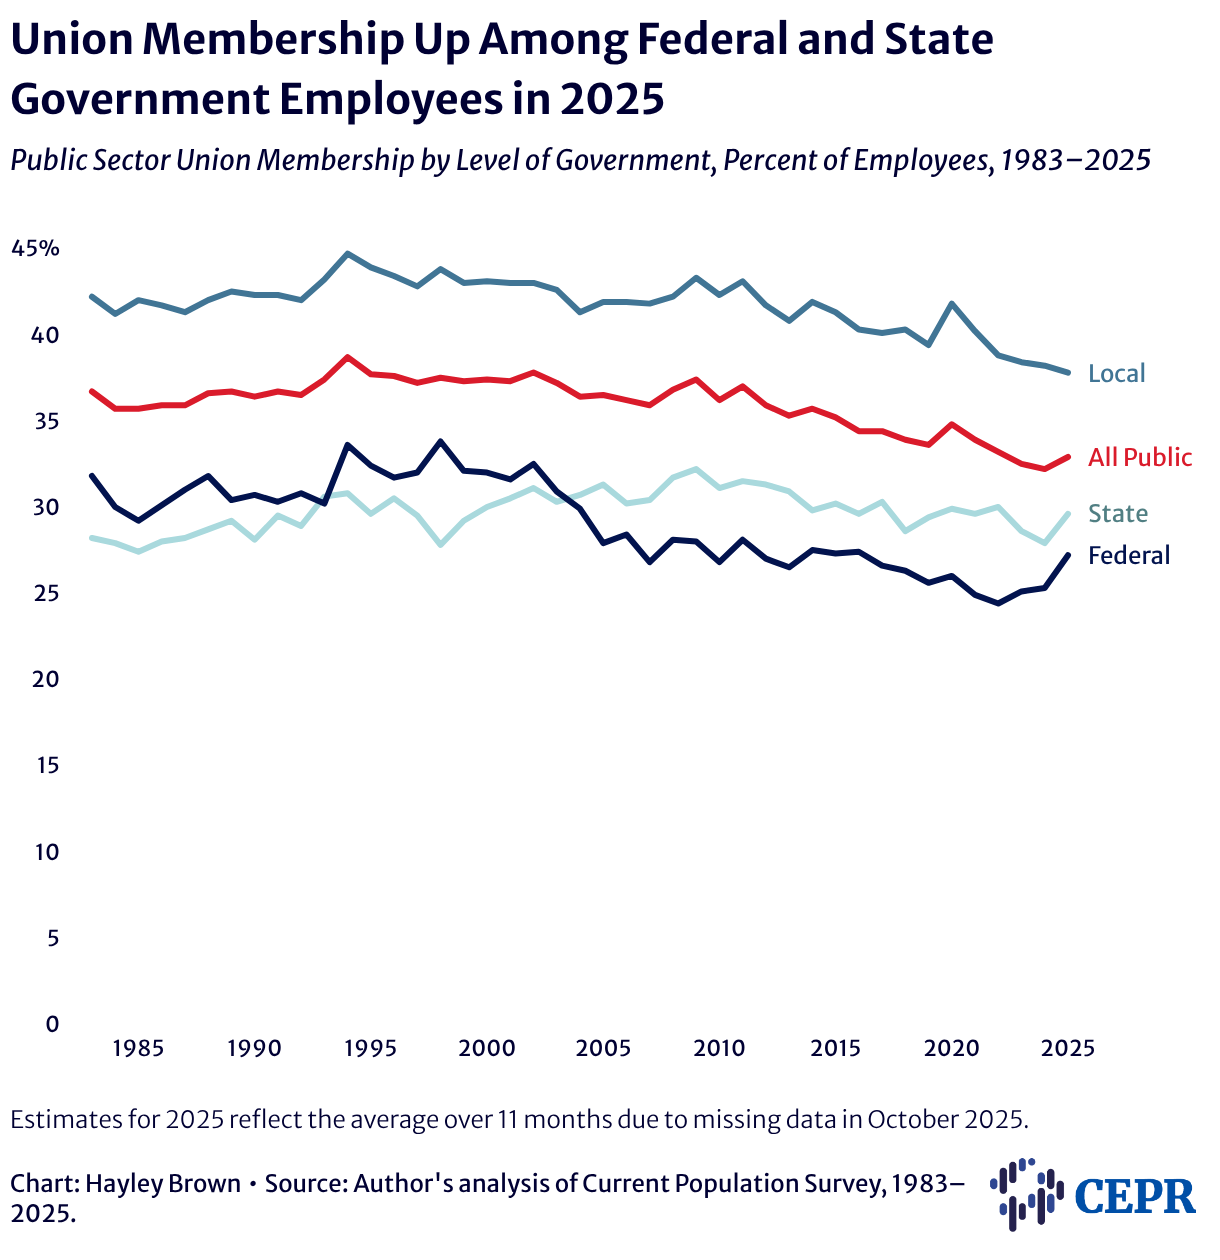
Union Membership Up Among Federal and State Government Employees in 2025
Public Sector Union Membership by Level of Government, Percent of Employees, 1983–2025
Line chart showing public-sector union membership rates by level of government from 1983 to 2025. Lines represent local government (blue), state government (light teal), federal government (navy), and all public employees combined (red). Local government workers consistently have the highest union membership rates, while federal workers have the lowest. Union membership rates in federal and state government increased in 2025.

Estimates for 2025 reflect the average over 11 months due to missing data in October 2025.