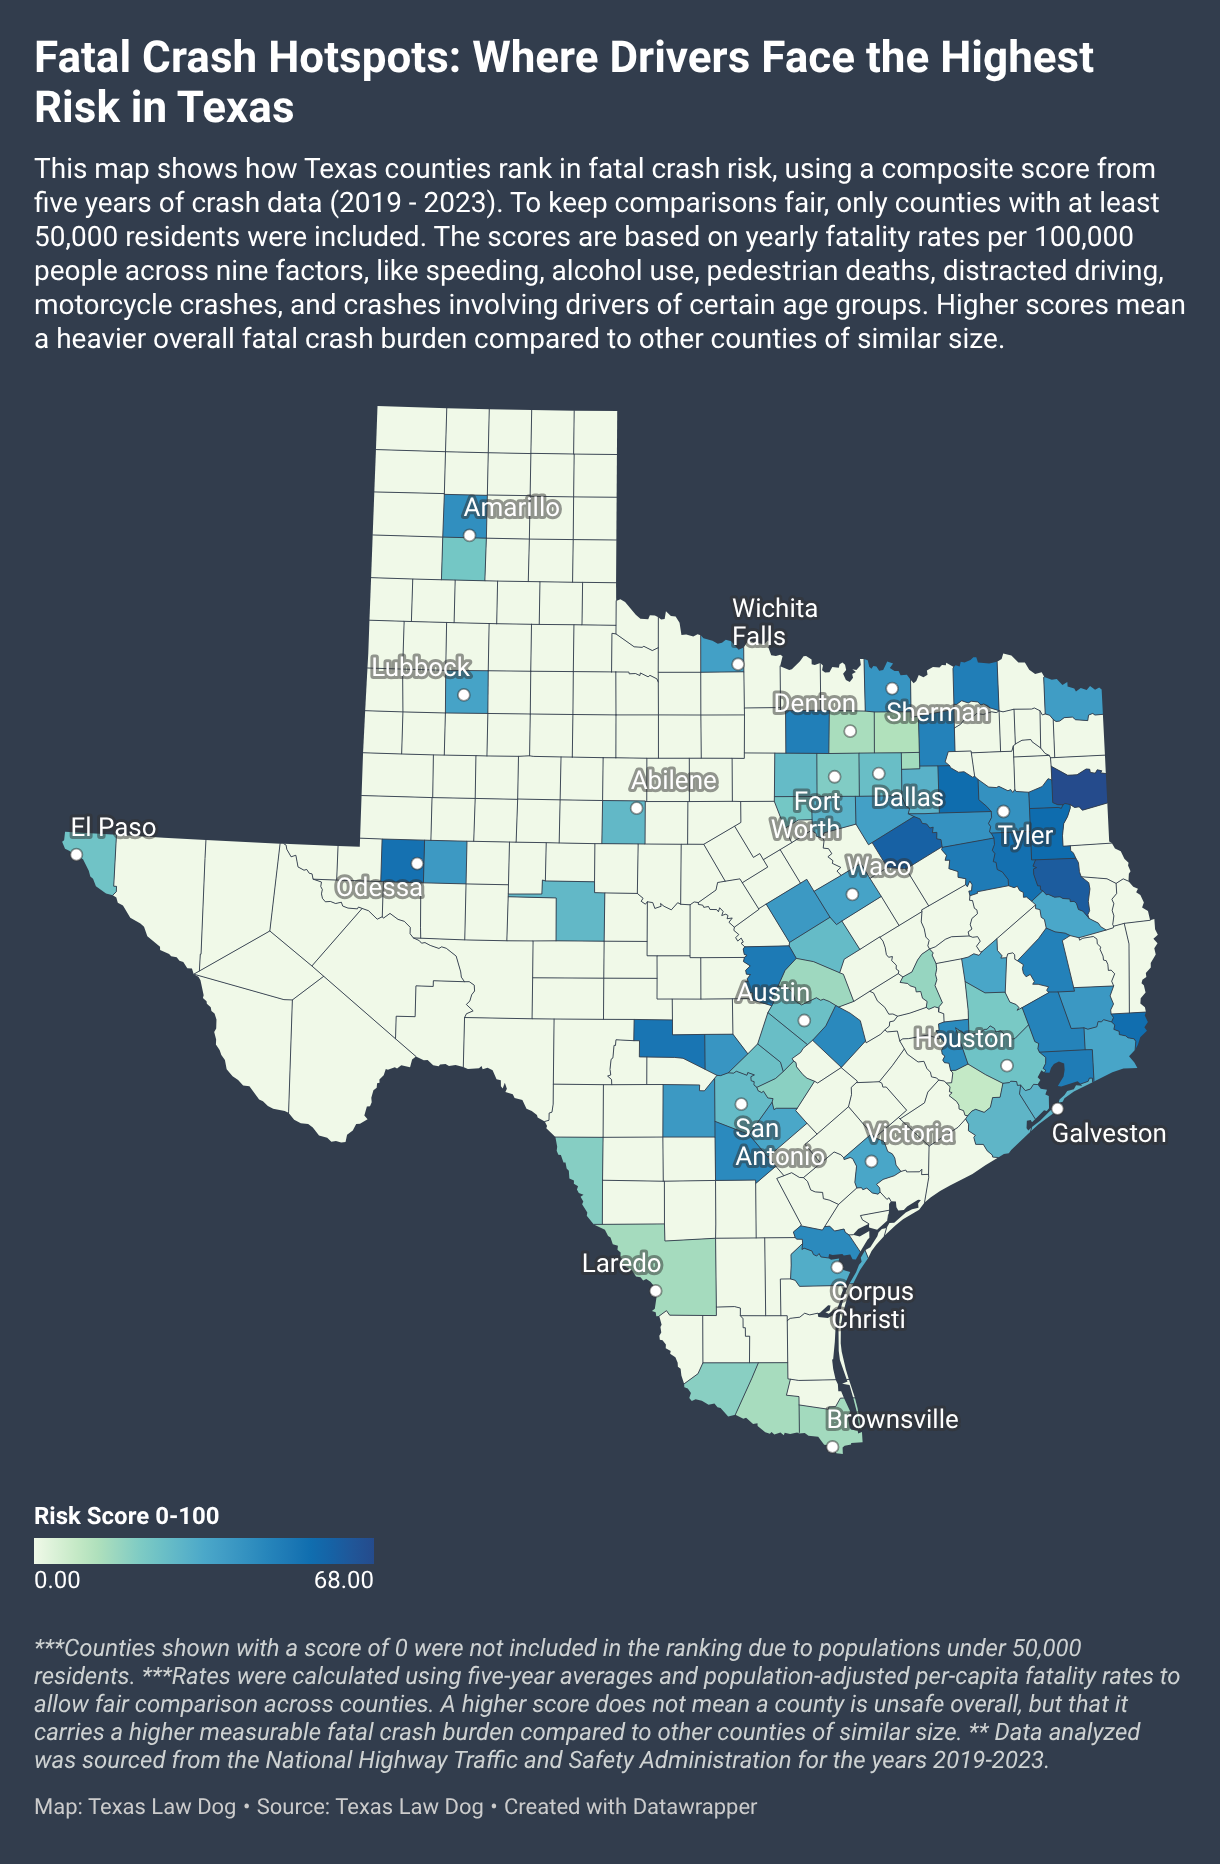
Fatal Crash Hotspots: Where Drivers Face the Highest Risk in Texas
This map shows how Texas counties rank in fatal crash risk, using a composite score from five years of crash data (2019 - 2023). To keep comparisons fair, only counties with at least 50,000 residents were included. The scores are based on yearly fatality rates per 100,000 people across nine factors, like speeding, alcohol use, pedestrian deaths, distracted driving, motorcycle crashes, and crashes involving drivers of certain age groups. Higher scores mean a heavier overall fatal crash burden compared to other counties of similar size.
