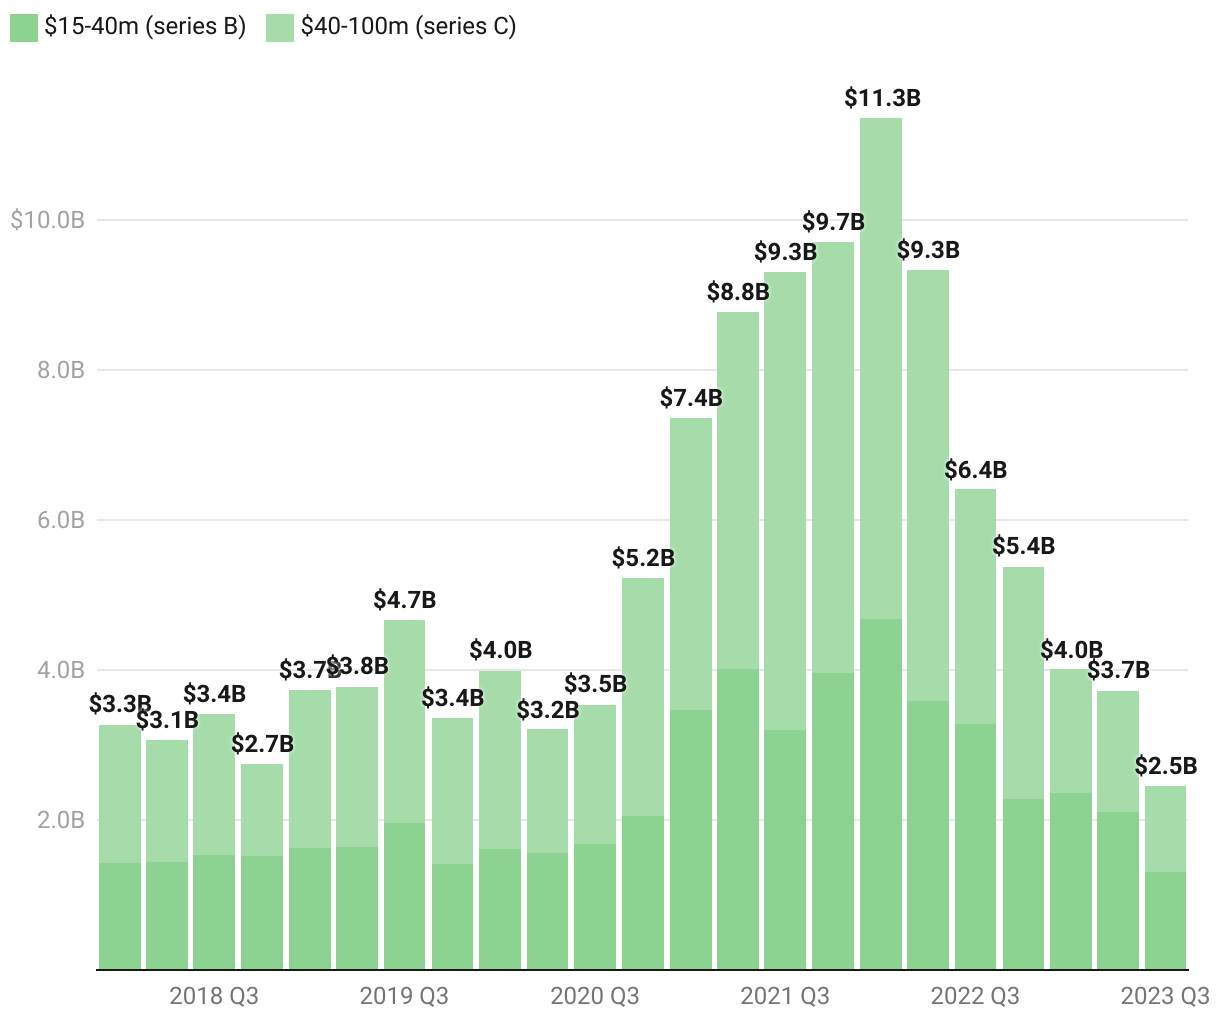
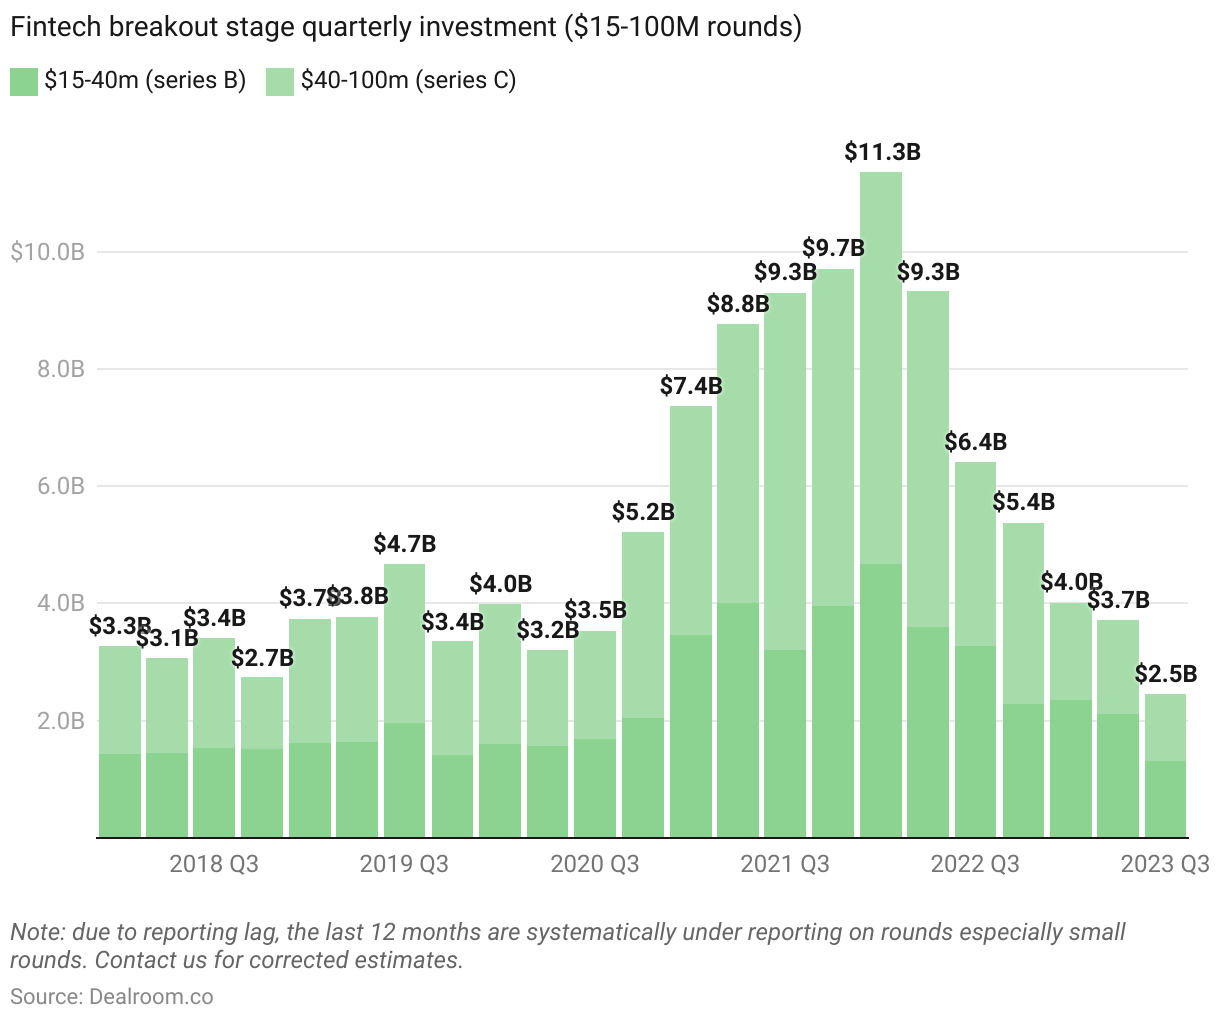
Fintech breakout stage quarterly investment ($15-100M rounds)
This stacked column chart displays the breakout stage investment into Fintech companies, as reported by Dealroom.co. The chart shows the investment figures in millions of dollars for each year from 2010 to 2022, and it is separated by investment round: $15-40m (series B), and $40-100m (series C). The chart is stacked, so each column represents the total investment for that year, and the different colors within the column represent the investment for each investment round.