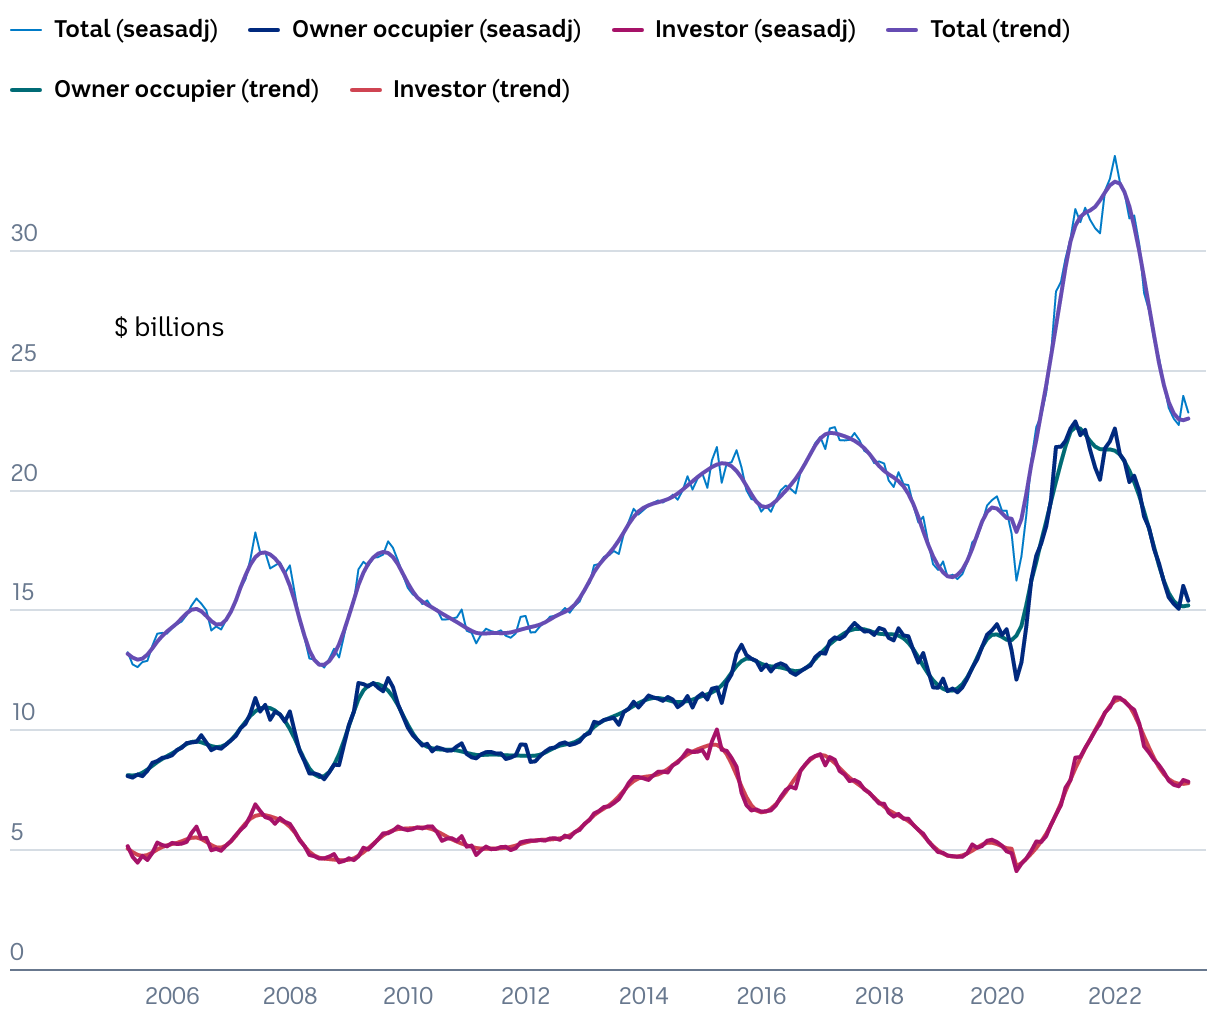
New loan commitments, total housing (seasonal adjusted and trend)
A line chart showing new loan commitments for total housing, owner occupier housing and investor housing in Australia between April 2005 and April 2023.
(Please use a modern browser to see the interactive version of this visualization)