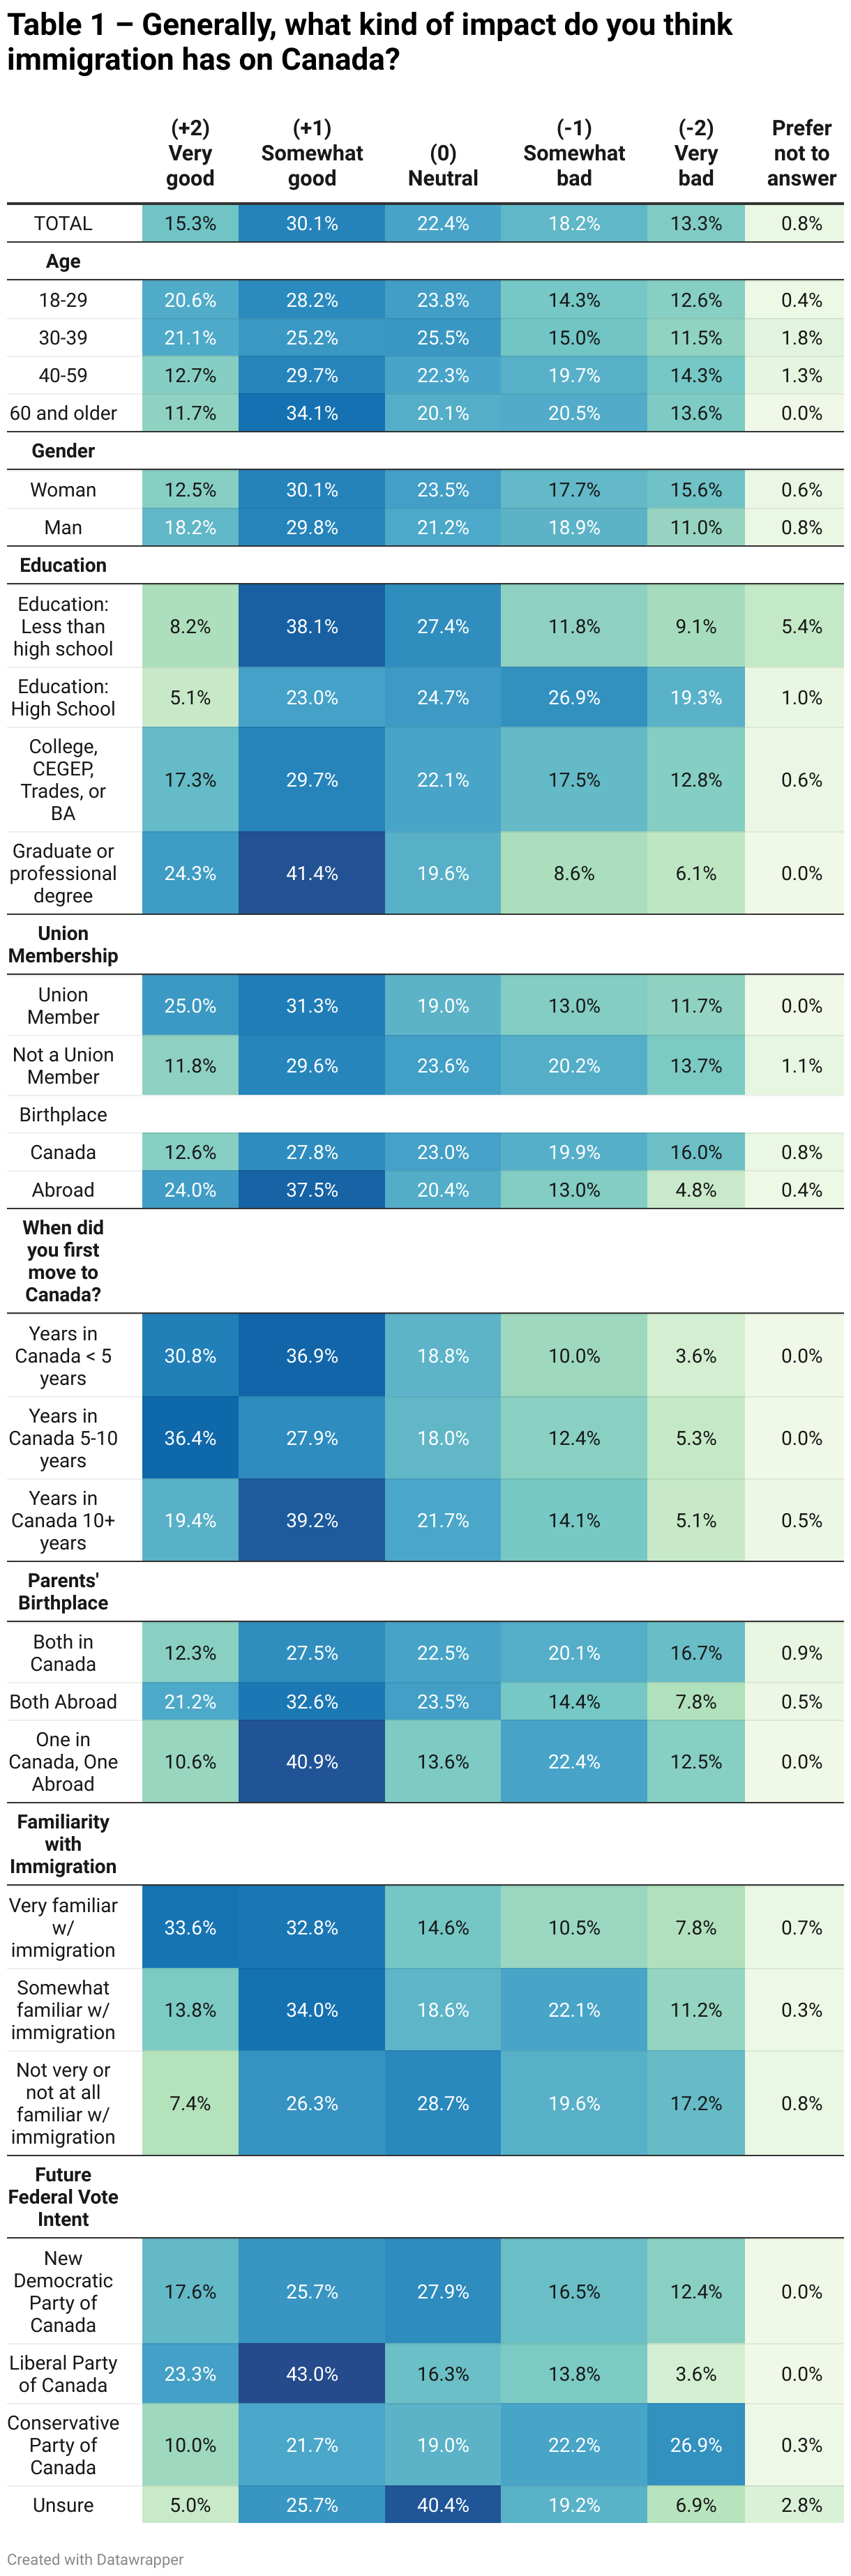
Table 1 – Generally, what kind of impact do you think immigration has on Canada?

Table with 7 columns and 37 rows.
TOTAL15.3%30.1%22.4%18.2%13.3%0.8%
Age
18-2920.6%28.2%23.8%14.3%12.6%0.4%
30-3921.1%25.2%25.5%15.0%11.5%1.8%
40-5912.7%29.7%22.3%19.7%14.3%1.3%
60 and older11.7%34.1%20.1%20.5%13.6%0.0%
Gender
Woman12.5%30.1%23.5%17.7%15.6%0.6%
Man18.2%29.8%21.2%18.9%11.0%0.8%
Education
Education: Less than high school8.2%38.1%27.4%11.8%9.1%5.4%
Education: High School5.1%23.0%24.7%26.9%19.3%1.0%
College, CEGEP, Trades, or BA17.3%29.7%22.1%17.5%12.8%0.6%
Graduate or professional degree24.3%41.4%19.6%8.6%6.1%0.0%
Union Membership
Union Member25.0%31.3%19.0%13.0%11.7%0.0%
Not a Union Member11.8%29.6%23.6%20.2%13.7%1.1%
Birthplace
Canada12.6%27.8%23.0%19.9%16.0%0.8%
Abroad24.0%37.5%20.4%13.0%4.8%0.4%
When did you first move to Canada?
Years in Canada < 5 years30.8%36.9%18.8%10.0%3.6%0.0%
Years in Canada 5-10 years36.4%27.9%18.0%12.4%5.3%0.0%
Years in Canada 10+ years19.4%39.2%21.7%14.1%5.1%0.5%
Parents' Birthplace
Both in Canada12.3%27.5%22.5%20.1%16.7%0.9%
Both Abroad21.2%32.6%23.5%14.4%7.8%0.5%
One in Canada, One Abroad10.6%40.9%13.6%22.4%12.5%0.0%
Familiarity with Immigration
Very familiar w/ immigration33.6%32.8%14.6%10.5%7.8%0.7%
Somewhat familiar w/ immigration13.8%34.0%18.6%22.1%11.2%0.3%
Not very or not at all familiar w/ immigration7.4%26.3%28.7%19.6%17.2%0.8%
Future Federal Vote Intent
New Democratic Party of Canada17.6%25.7%27.9%16.5%12.4%0.0%
Liberal Party of Canada23.3%43.0%16.3%13.8%3.6%0.0%
Conservative Party of Canada10.0%21.7%19.0%22.2%26.9%0.3%
Unsure5.0%25.7%40.4%19.2%6.9%2.8%