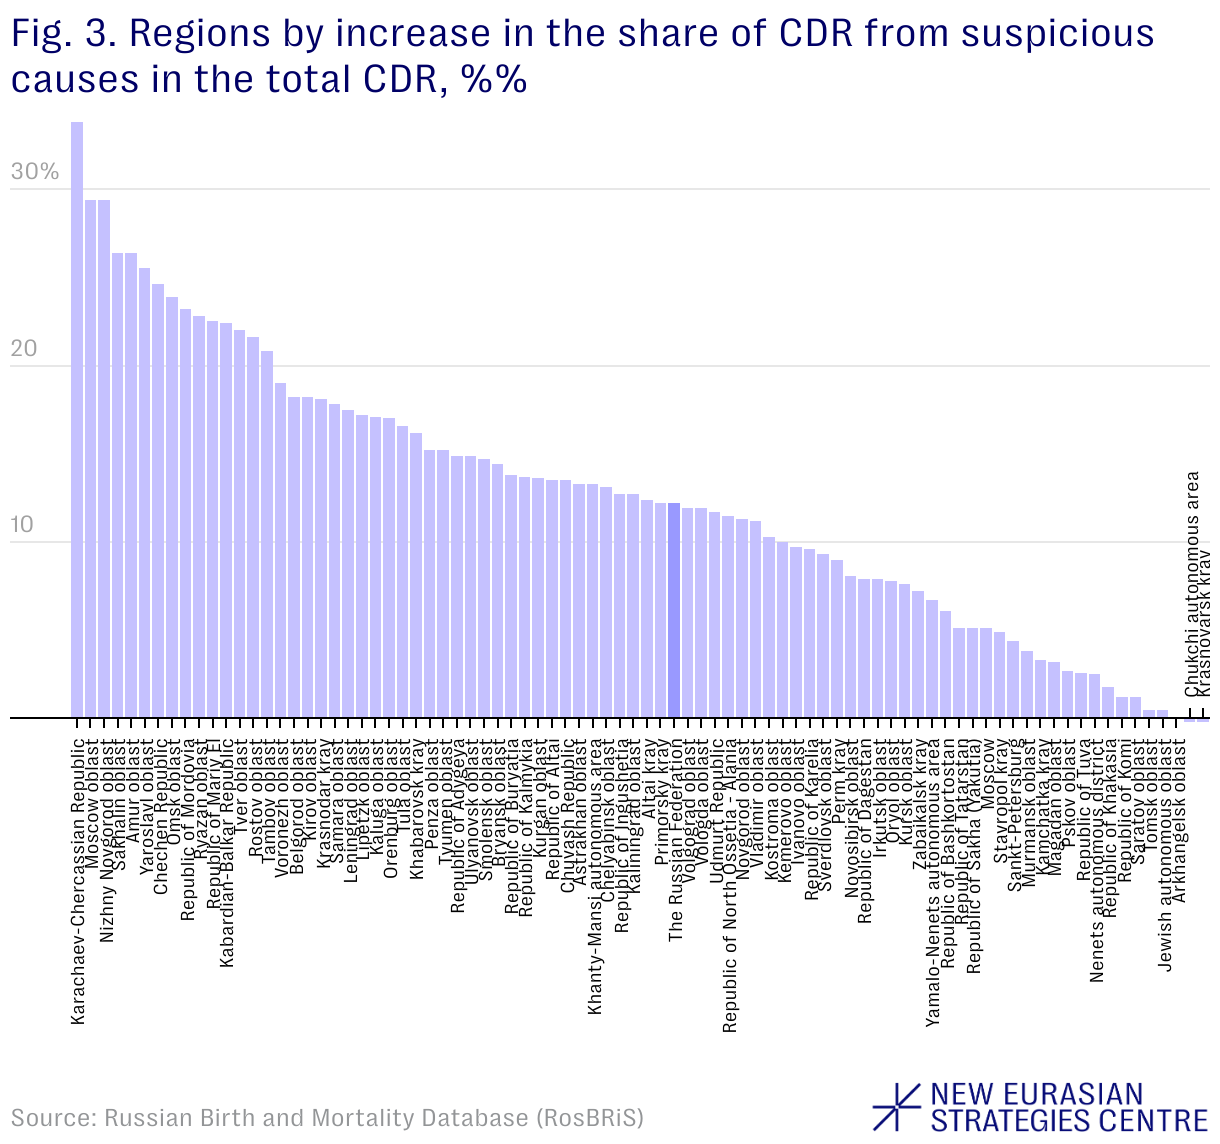
Fig. 3. Regions by increase in the share of CDR from suspicious causes in the total CDR, %%
(Please use a modern browser to see the interactive version of this visualization)
