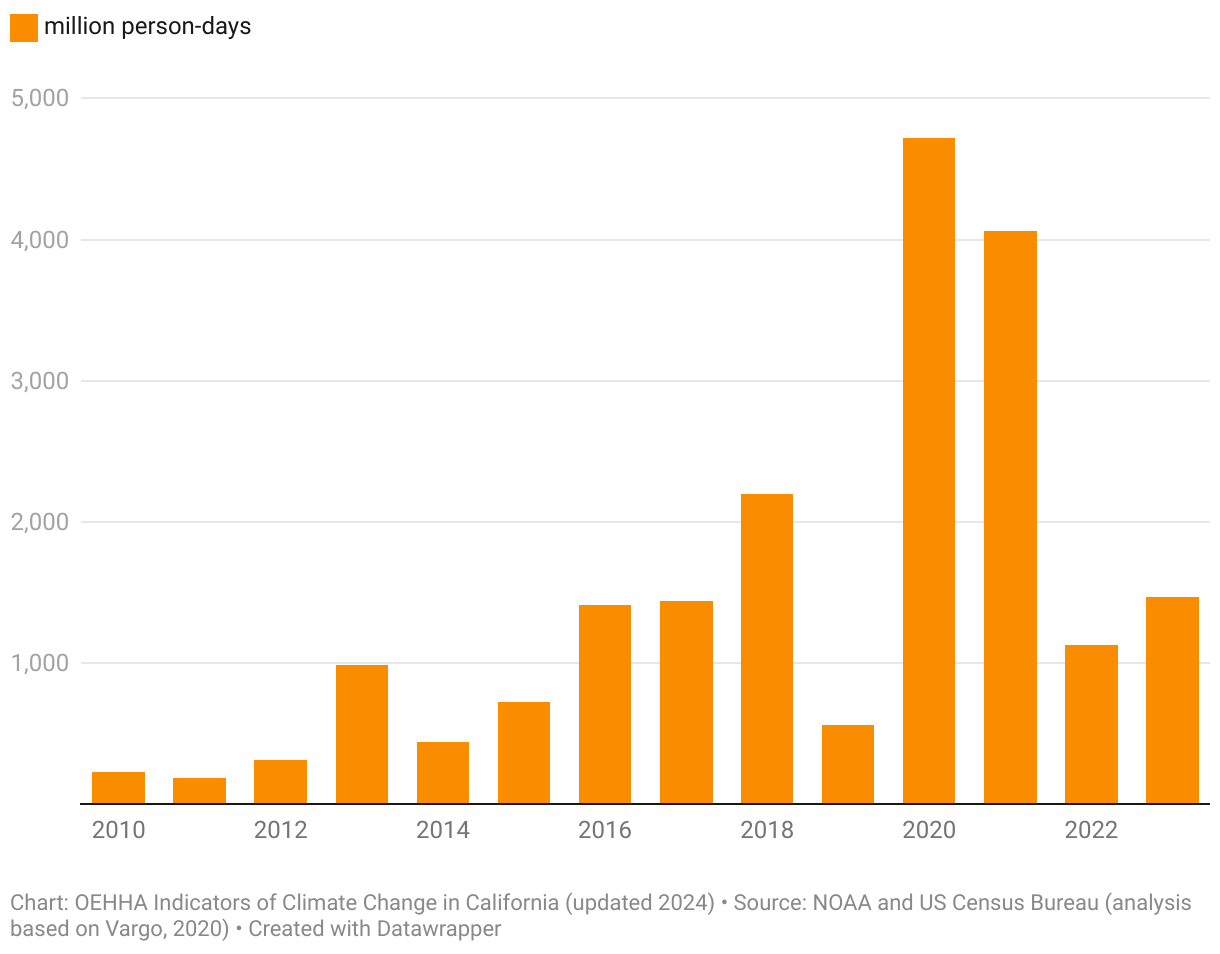
This graph presents potential population exposures to wildfire smoke, 2010-2023. Shown are “person days” or the estimated number of people (in millions) living in areas where smoke plumes were present multiplied by the number of days when the plumes were present. The number of person days since 2010 has risen dramatically, especially in 2020 and 2021.
