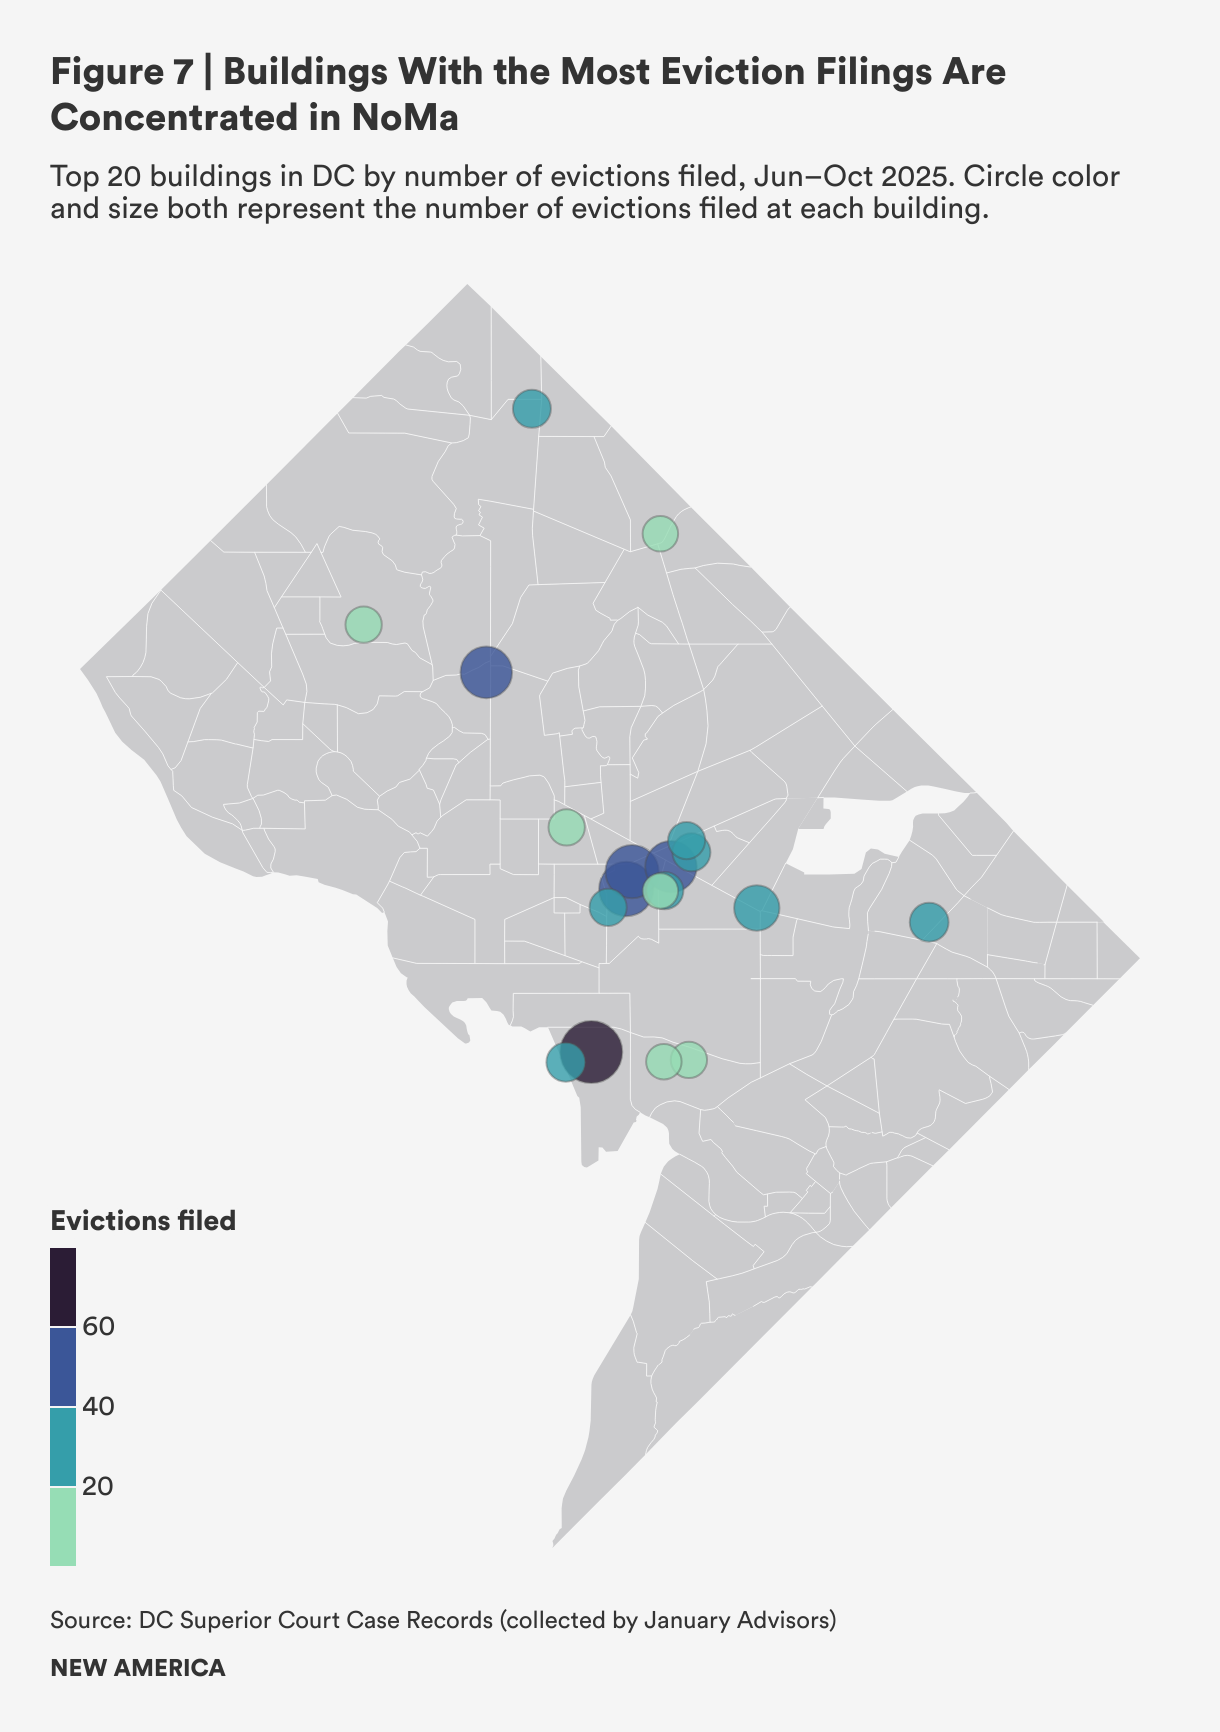
Figure 7 | Buildings With the Most Eviction Filings Are Concentrated in NoMa
Top 20 buildings in DC by number of evictions filed, Jun–Oct 2025. Circle color and size both represent the number of evictions filed at each building.
Map of DC with circles marking locations of the top 20 buildings by number of evictions filed Jun-Oct 2025. Each circle's size and color represents the number of evictions filed at that building. There is a cluster of these buildings in the NoMa neighborhood.
